1 / 9
90 likes | 127 Views
Presentation about 'Getting upside NO downside'

E N D
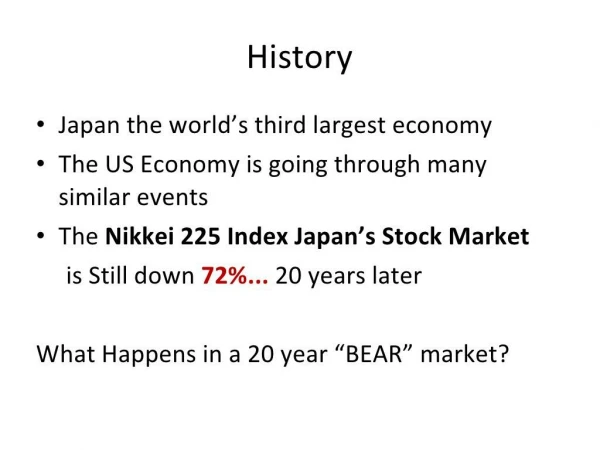
Getting upside NO downside History <ul><li>Japan the world’s third largest economy </li></ul><ul><li>The US Economy is going through many similar events </li></ul><ul><li>The Nikkei 225 Index Japan’s Stock Market </li></ul><ul><li>is Still down 72%... 20 years later </li></ul><ul><li>What Happens in a 20 year “BEAR” market? </li></ul>
38,915.44 December 29, 1989 Jan 1, 2010 9,346.13 -72.9% below its closing high Nikkei 225 Index 40 year history 38,915.44 December 29, 1989 Jan 1, 2010 9,346.13 -72.9% below its closing high Nikkei 225 Index 40 year history
. . . . . . The reality is some never recover from a double digit loss. . . . . . . The reality is some never recover from a double digit loss.
<ul><li>Indexed Accounts do exactly that </li></ul><ul><li>Capture each years of positive gains, and </li></ul><ul><li>eliminate each negative years. </li></ul><ul><li>Major Index Leader </li></ul>The difference that simply eliminating the negative years makes Is Substantial <ul><li>Indexed Accounts do exactly that </li></ul><ul><li>Capture each years of positive gains, and </li></ul><ul><li>eliminate each negative years. </li></ul><ul><li>Major Index Leader </li></ul>The difference that simply eliminating the negative years makes Is Substantial