Download
1 / 12
130 likes | 428 Views
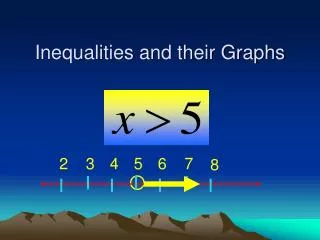
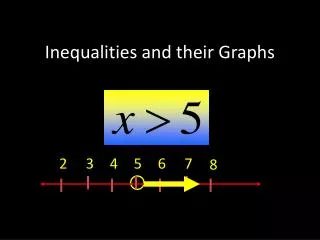
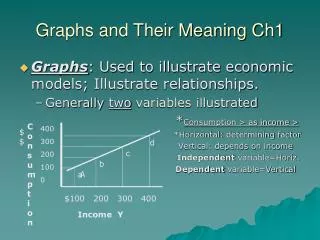
Graphs and Their Meaning Ch1. Graphs : Used to illustrate economic models; Illustrate relationships. Generally two variables illustrated * Consumption > as income > *Horizontal: determining factor

E N D
Graphs and Their Meaning Ch1 • Graphs: Used to illustrate economic models; Illustrate relationships. • Generally two variables illustrated *Consumption > as income > *Horizontal: determining factor Vertical: depends on income Independent variable=Horiz. Dependent variable=Vertical Consumption 400 300 200 100 0 $$ d c b A a $100 200 300 400 Income Y
Graphs • Direct relationship (Positive): the two variables (consumption & income) change in the same direction. • >consumption = >income • <consumption= < income • 2 variables change positively they always graph as an upsloping line.
Graphs() Inverse relationship 2 Variables change in opposite directions. *Ticket prices < attendance > *Ticket prices > attendance < *Inverse relationship causes the line to slope downward. “Which variable is the cause and which is the effect???” Ticket Price (P) 60 50 40 30 20 10 0 a b c d e f 0 4 8 12 16 20 30 Attendance in 1000’s
Ceteris Paribus • Ceteris Paribus=“ • All other things being equal.” • Plots relationship between two variables and assumes ceteris paribus. • In reality: All “other things” are not equal • What could change attendance other than ticket prices?
Slope of Line • Slope = Vertical change/Horizontal chg. Slope= VC/HC Between points B/C: Vertical: +$50 Horizontal: +$100 +50/+100=1/2=.5 Consumption 400 300 200 100 0 c b A a Income Y
Positive Slope of Line • Slope is positive .5 because consumption and income increase in the same direction; Consumption and income are directly or positively related. • Slope of .5 tells us the following: • $1 increase in consumption for every $2 increase in income. • $2 decrease in income there will be a $1 decrease in consumption.
Slope=VC/HC (Points c and d) VC = -10 drop HC = +4 Ticket prices & attendance have an inverse relationship. -10/+4=-2 ½ or -2.5 What does it say? Negative Slope 60 50 40 30 20 10 0 a b c Ticket Price P d e 16 20 4 8 12 Attendance in 1000’s
Slope and Marginal Analysis • Marginal=Adding one more/less unit. • The .5 slope shows that $.50 of extra (marginal) consumption is associated with each $1 change in income. • The -2.5 slope shows that $10 increase in ticket prices will result in a 4,000 decrease in attendance. • A $10 decrease in attendance will result in an increase in attendance.
Vertical Intercept • Vertical Intercept: of a line is the point where the line meets the vertical axis. VI=$50 If current income=0; still spend? Consumption $$ 400 300 200 100 0 c b A a $100 200 300 400 $ Income (Y)
Infinite Slope • Infinite slope: Variables are unrelated or independent of one another. • Ex. The purchase of wrist watches is not related to the price of bananas. • Slope of line is parallel to vertical axis. • Same quantity of watches is purchased regardless of price of bananas. Consumption Price Ban Slope= Infinite Slope = 0 0 Divorce Rate Watches bought
Linear Relationship • If we know the vertical intercept and slope, we can describe a line in equation form. • C=a+bx • a=vertical intercept • C=consumption • b=slope of line • x=independent variable
Slope of Nonlinear Curve • Slope of straight line is the same at all points. • Slope of nonlinear line changes from point to point. Lines are called curves. Measure slope=draw line tangent to curve *Slope of the curved line =slope of tangent a 20 15 10 5 0 b b A B b a 0 5 10 15 20