Download
1 / 13
130 likes | 151 Views
This overview provides a comprehensive analysis of Medicare payments and spending in various settings, including hospitals, physician services, and prescription drug plans. It explains the payment methodology and updates for different services and discusses the implementation of competitive bidding and Medicare Advantage payments.

E N D
Thomas A. Gustafson, Ph.D. Senior Policy Advisor March 16, 2008 OVERVIEW OF Medicare payments
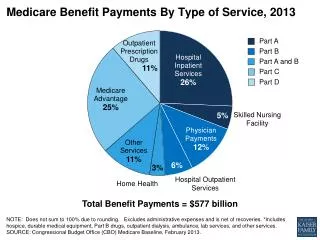
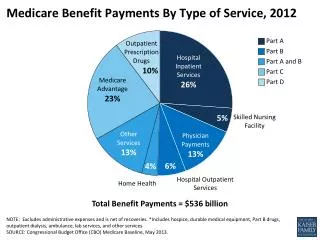
Total Medicare benefit spending for 2007$428 billion Source: CMS Office of the Actuary, 2008, as reported by MedPAC
Original Medicare (“FFS”) Benefits • Part A - Hospital Insurance (HI) • Inpatient hospital stays, including • Critical access hospitals • Mental health care • Skilled nursing facilities (not custodial or long-term care). • Hospice care • Some home health care • Part B – Supplemental Medical Insurance (SMI) • Physician services • Hospital outpatient care • Other medical services and supplies not covered by Part A , e.g. • Durable medical equipment • Clinical labs
FFS Payment – How Much? • Payment rates set in advance • Based largely on average resource use • Individual providers may win or lose • Rates not set to cover the costs of an individual provider • Twelve different payment systems
Generalized Payment Methodology • Each patient or procedure is classified by resource use • Each class is assigned a “relative value” • Used to assign a payment rate for the case: • Multiply the relative value of the case by a dollar multiplier based on average resource consumption ( the “standardized amount” or “conversion factor”). • Apply geographic adjuster (wage index or geographic practice cost index), if any. • Apply any applicable adjustments.
Inpatient Hospital PPS (IPPS) • Patients are grouped into Diagnosis Related Groups (DRGs); hospitals report the diagnoses. • Each DRG has a weight, • Multiplied by a standardized amount based on hospital costs, • To yield a fixed payment, varying by DRG, for all services provided during the patient’s stay. • Adjusted for local wages, low income patients, medical education, etc.
Physician Fee Schedule • Pays physicians and other practitioners. • About 7000 codes. • Payment amount for each service based on relative value units (RVUs) reflecting • Physician “work”, • Practice expenses, and • Malpractice. • Payment is adjusted for local cost differences.
Updating Physician Payment Rates • Use a spending target: the Sustainable Growth Rate (SGR) • Future updates are adjusted to reflect past spending above or below the target • SGR is set to reflect: • Inflation • Change in the number of beneficiaries • Projected growth in the real per capita gross domestic product • Change in expenditures due to changes in laws or regulations • For 2010 • The SGR system is set to yield a negative 20% update for physicians services. • President Obama’s budget contemplates fixing the law
DME Competitive Bidding • Delayed by MIPPA, but now expected to proceed • Phased-in implementation beginning with competition in 2009 • To start with 9 of the largest cities • In 2011, 70 more large cities • Additional areas after 2011 • Items with highest cost & volume/greatest savings potential • Follows successful demonstrations
Medicare Advantage Payments • “Benchmark” set through combination of county-specific rates based on FFS, other floors, and premium bids under new MA program • If plan bids below benchmark, 25% rebate goes to government, 75% retained for beneficiary premium reduction/benefit enhancement • Payments to plans adjusted for risk associated with particular patients
Medicare Advantage Payments Relative to Medicare Advantage Payments Relative to Traditional Fee - for - Service Medicare, 2009 Traditional Fee - for - Service Medicare, 2009 118% 118% 116% 114% 113% 112% 100% Traditional All Local Local PPOs Regional Private Special Fee-for- Medicare HMOs PPOs Fee-For- Needs Service Advantage Service Plans Medicare Plans Plans Medicare Advantage Plan Types NOTE: HMO is health maintenance organization; PPO is preferred p rovider organization. NOTE: HMO is health maintenance organization; PPO is preferred p rovider organization. SOURCE: Medicare Payment Advisory Commission, December 2008. SOURCE: Medicare Payment Advisory Commission, December 2008.
Payments to Part D plans • National average bidding, benchmarking process • Medicare subsidizes about 75% of average premium; beneficiary pays about 25% • Beneficiary pays less for plans below average, and more for those above that average • Risk adjusted payments from Medicare • Subsidies for those with low income, so long as they enroll in plans with average or lower premium (with special adjustments) • Special subsidies for employment-based plans that offer prescription drug coverage