Download
1 / 19
190 likes | 268 Views
Understand the principles behind nitrogen standard reductions, including the basis for calculations and the annual adjustments in nitrogen quotas. Explore the implications and addressing of problems related to nitrogen bag adjustments and N-standard reductions. The text language is English.

E N D
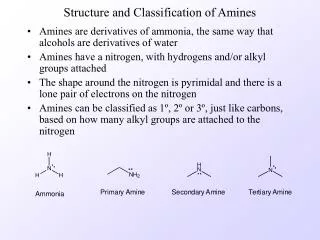
How are the nitrogen standards reduced? Ruth Grant National Environmental Reseach InstituteAarhus University
Content • Principles for N standard reduction • Basis for calculation • The annualcalculation • Conclusion
Background (Action Plan III, 2005) • Decision takingplace from 2005/06 • The economic optimum for nitrogen standards shallbe set at a the cropyield, whichwould have beenoptainedwithoutrestrictions in N use • The nitrogen standards used by the farmersshallbereduced by minimim 10% relative to the economic optimum • The nitrogen quota at the national levelmust not exceed the quota in 2003/04 (next slide)
National nitrogen quota The nitrogen quota at the national level = national nitrogen bag • must not exceed the quota in 2003/04, adjusted for the crop rotation
Problems to be addressed • In 2005 the EU subsidypayment changed to the single payment – increase in registeredagriculturalarea (nochange in actualarea): adjustmentneeded • Action Plan III from 2005 had severalareaassignments – actualdecrease in agriculturalarea: noeffect on N bag and noeffect of measures • In 2008 no longer set-aside obligations - actualincrease in agriculturalarea: noeffect on N bag
Overall principle • N bag adjustedeachyearbased on • Crop rotation (step 1) • New areaassigned for roads, buildings etc. (step 2) • N standard reduction % calculatedaccording to adjusted N bag (step 3) Twoyears of timelag relative to actual agricuturalarea 2010/2011: 385 000 tons N • N rate per ha: economic optimum for eachcropreduced by N standard reduction% (step 4)
Basis - calculation of N bag for 2003/04- adjusted for extra registered area in 2005
Calculation of N bag for 2010/11 (step 1): - based on N rates in 2004 and crop rotaion in 2009, adjusted to the area in 2004
Calculation of adjusted N bag in 2011 (step 2):- adjusted for area assigned for roads, etc. • N quota in 2011 (step 1): 386 924 tons N • Area in 2009: 2671 700 ha • Average N standard: 144.8 kg N/ha • Area assigned for roads etc: 10 000 ha • Reduction in N quota (step 2): 1 448 tons N • N bag in 2011: 385 476 tons N
Calculation of N standard reduction in 2011 (step 3) *) for loamy sand **) adjusted for soil type and residual effect
Calculation of N rate for crops (step 4) The Plant Directorate publishes an announcement each year with updated N rates for each crop and 5 different soil types *) for loamy sand
N standard reduction obtained • % reduction N bag (1000 tons) • 2005/06 14,3 % 362 942 • 2006/07 14,4 % 362 942* • 2007/08 15,0 % 362 942* • 2008/09 14,5 % 368 543 • 2009/10 15,5 % 381 655 • 2010/11 16,0 % 385 476 * No corrections for largerregisteredagriculturalarea
Effect of change in agric area • tackled • VMP III – reduction in agric. area • Roads, buildings, etc. √ • Afforestation ÷ • Wetlands, bufferzones÷ • No Set- aside - increase in agric. area • 81000 ha in 2008 • + 35 000 ha in 2009 Increased norm reduction in 2010 and 2011, √ but temporaryincrease in fertilser use in 2008 and 2009