Download
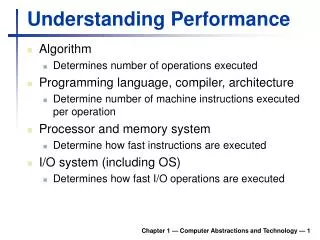
1 / 31
310 likes | 433 Views
Discovering and Understanding Performance Bottlenecks in Transactional Applications. Ferad Zyulkyarov 1,2 , Srdjan Stipic 1,2 , Tim Harris 3 , Osman S. Unsal 1 , Adrián Cristal 1,4 , Ibrahim Hur 1 , Mateo Valero 1,2. 1 BSC-Microsoft Research Centre 2 Universitat Politècnica de Catalunya

E N D
Discovering and Understanding Performance Bottlenecks in Transactional Applications Ferad Zyulkyarov1,2, SrdjanStipic1,2, Tim Harris3, Osman S. Unsal1, Adrián Cristal1,4, Ibrahim Hur1, Mateo Valero1,2 1BSC-Microsoft Research Centre 2Universitat Politècnica de Catalunya 3Microsoft Research Cambridge 4IIIA - Artificial Intelligence Research Institute CSIC - Spanish National Research Council 19th International Conference on Parallel Architectures and Compilation Techniques 11-15 September 2010 – Vienna
Abstract the TM Implementation Accesses to different arrays. We can observe overheads inherent to the TM implementation. Thread 1 Thread 2 We are not interested in such bottlenecks. for (i = 0; i < N; i++) { atomic { x[i]++; } } for (i = 0; i < N; i++) { atomic { y[i]++; } }
Abstract the TM Implementation Accesses to the same arrays. Contention: Bottleneck common to all implementations of the TM programming model. Thread 1 Thread 2 We are interested in this kind of bottlenecks. for (i = 0; i < N; i++) { atomic { x[i]++; } } for (i = 0; i < N; i++) { atomic { x[i]++; } }
Can We Find This Kind of Bottlenecks? atomic { statement1; statement2; statement3; statement4; } Where aborts happen? Which variables conflict? Are there false conflicts? Abort rate 80%
Can We Find This Kind of Bottlenecks? atomic { statement1; statement2; statement3; statement4; } counter1=0; counter2=0; counter3=0; counter4=0;
Can We Find This Kind of Bottlenecks? atomic { statement1; statement2; statement3; statement4; } counter1=1; counter2=0; counter3=0; counter4=0;
Can We Find This Kind of Bottlenecks? atomic { statement1; statement2; statement3; statement4; } Conflict between statement2 and statement4. counter1=1; counter2=1; Goal Profiling techniques to find bottlenecks (important conflicting locations) and why these conflicts happen. counter3=0; counter4=0;
Outline Profiling Techniques Implementation Case Studies
Profiling Techniques Visualizing transactions Conflict point discovery Identifying conflicting data structures
Transaction Visualizer (Genome) When these aborts happen? 14% Aborts Garbage Collection Wait on barrier Aborts occur at the first and last atomic blocks in program order.
Aborts Graph (Bayes) AB5 AB15 AB14 AB13 AB10 AB12 AB11 AB1 AB2 AB8 AB6 AB7 AB9 AB3 73% 20% AB4 93% Aborts
Number of Aborts vs Wasted Work Aborts = 9 Aborts = 1 Wasted Work = 10% Wasted Work = 90% atomic { counter++ } atomic { hashtable.Rehash(); }
Conflicts Context increment() { counter++; } probability20 { probability = random() % 100; if (probability >= 80) { atomic { increment(); } } } All conflicts happen here. Thread 1 ------------ for (int i = 0; i < 100; i++) { probability80(); probability20(); } Bottom-up view + increment (100%) |---- probability80 (80%) |---- probability20 (20%) Top-down view + main (100%) |---- probability80 (80%) |---- increment (80%) |-----probability20 (20%) |---- increment (20%) probability80 { probability = random() % 100; if (probability < 80) { atomic { increment(); } } } Thread 2 ------------ for (int i = 0; i < 100; i++) { probability80(); probability20(); }
Identifying multiple conflictsfrom a single run Conflict detected at 1st iteration Thread 1 Conflict detected at 2nd iteration Thread 2 Conflict detected at 3rd iteration atomic { ... ... ... obj1.x = t1; obj2.x = t2; obj3.x = t3; } atomic { obj1.x = t1; obj2.x = t2; obj3.x = t3; ... ... ... }
Identifying Conflicting Objects List list = new List(); list.Add(1); list.Add(2); list.Add(3); ... atomic { list.Replace(3, 33); } List 1 2 3 0x08 0x10 0x18 0x20 Per-Object View + List.cs:1 “list” (42%) |--- ChangeNode (20 %) +---- Replace (12%) +---- Add (8%) GC Root 0x08 Object Addr 0x20 GC DbgEng Variable Name (list) Instr Addr 0x446290 Memory Allocator DbgEng List.cs:1
Outline Profiling Techniques Implementation • Bartok • The data that we collect • Probe effect and profiling Case Studies
Bartok • C# to x86 research compiler with language level support for TM • STM • Eager versioning (i.e. in place update) • Detects write-write conflicts eagerly (i.e. immediately) • Detects read-write conflicts lazily (i.e. at commit) • Detects conflicts at object granularity
Profiling Data That We Collect • Timestamp • TX start, • TX commit or TX abort • Read and write set size • On abort • The instruction of the read and write operations involved in the conflict • The conflicting memory address • The call stack • Process data offline or during GC
Probe Effect and Overheads Normalized Abort Rates Average 0.016 Normalized Execution Time Average 0.25
Outline Profiling Techniques Implementation Case Studies
Case Studies Bayes Intruder Labyrinth
Bayes Create wrapper object. Wrapper object for function arguments. public class FindBestTaskArg { public inttoId; public Learner learnerPtr; public Query[] queries; public Vector queryVectorPtr; public Vector parentQueryVectorPtr; public intnumTotalParent; public float basePenalty; public float baseLogLikelihood; public Bitmap bitmapPtr; public Queue workQueuePtr; public Vector aQueryVectorPtr; public Vector bQueryVectorPtr; } FindBestTaskArgarg = new FindBestTaskArg(); arg.learnerPtr = learnerPtr; arg.queries = queries; arg.queryVectorPtr = queryVectorPtr; arg.parentQueryVectorPtr = parentQueryVectorPtr; arg.bitmapPtr = visitedBitmapPtr; arg.workQueuePtr = workQueuePtr; arg.aQueryVectorPtr = aQueryVectorPtr; arg.bQueryVectorPtr = bQueryVectorPtr;
Bayes Create wrapper object. 98% of wasted work is due to the wrapper object 2 threads – 24% execution time 4 threads – 80% execution time public class FindBestTaskArg { public inttoId; public Learner learnerPtr; public Query[] queries; public Vector queryVectorPtr; public Vector parentQueryVectorPtr; public intnumTotalParent; public float basePenalty; public float baseLogLikelihood; public Bitmap bitmapPtr; public Queue workQueuePtr; public Vector aQueryVectorPtr; public Vector bQueryVectorPtr; } FindBestTaskArgarg = new FindBestTaskArg(); arg.learnerPtr = learnerPtr; arg.queries = queries; arg.queryVectorPtr = queryVectorPtr; arg.parentQueryVectorPtr = parentQueryVectorPtr; arg.bitmapPtr = visitedBitmapPtr; arg.workQueuePtr = workQueuePtr; arg.aQueryVectorPtr = aQueryVectorPtr; arg.bQueryVectorPtr = bQueryVectorPtr; atomic { FindBestInsertTask(BestTaskArgarg) } Call the function using the wrapper object.
Bayes – Solution Passed the arguments directly and avoid using wrapper object. atomic { FindBestInsertTaskArg ( toId, learnerPtr, queries, queryVectorPtr, parentQueryVectorPtr, numTotalParent, basePenalty, baseLogLikelihood, bitmapPtr, workQueuePtr, aQueryVectorPtr, bQueryVectorPtr, ); }
Intruder – Map Data Structure Network Stream Assembled packet fragments 6/4 2/4 4/3 1 4 1 1 1 2 2 2 3 3/1 2 1/3 6/2 6/3 3 4 5 6
Intruder – Map Data Structure Network Stream Replaced with a chaining hashtable. Assembled packet fragments 6/4 2/4 4/3 1 4 1 1 1 2 2 3 2 3/1 Aborts caused 68% wasted work. 2 1/3 6/2 6/3 3 4 5 6
Intruder – Moving Code Little to roll back, less wasted work More to roll back more wasted work atomic { Decoded decodedPtr = new Decoded(); char[] data = new char[length]; Array.Copy(packetPtr.Data, data, length); decodedPtr.flowId = flowId; decodedPtr.data = data; } this.decodedQueuePtr.Push(decodedPtr); Write-write conflicts are detected eagerly.
Labyrinth Watson PACT’07, it is safe if localGrid is not up to date. 2 threads – 80% wasted work 4 threads – 98% wasted work atomic { localGrid.CopyFrom(globalGrid); if (this.PdoExpansion(myGrid, myExpansionQueue, src, dst)) { pointVector = PdoTraceback(grid, myGrid, dst, bendCost); success = true; raced = grid.addPathOfOffsets(pointVector); } } Don’t instrument CopyFromwith transactional read and writes.
Summary • Design principles • Abstract the underlying TM system • Report results at the source language constructs • Low instrumentation probe effect and overhead • Profiling techniques • Visualizing transactions • Conflict point discovery • Identifying conflicting data structures
PPoPP’2010 Debugging Programs that use Atomic Blocks and Transactional Memory ICS’2009 QuakeTM: Parallelizing a Complex Serial Application Using Transactional Memory PPoPP’2008 Atomic Quake: Using Transactional Memory in an Interactive Multiplayer Game Server Край