Download
1 / 26
260 likes | 426 Views
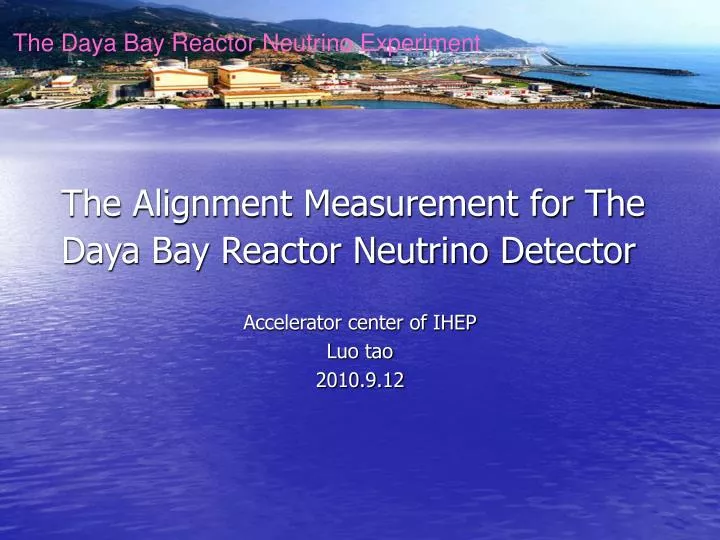
The Daya Bay Reactor Neutrino Experiment. The Alignment Measurement for The Daya Bay Reactor Neutrino Detector. Accelerator center of IHEP Luo tao 2010.9.12. Content 1.Introduction 2.Simulation 3.The alignment measurement with GPS 4.The data processing 5.Analysis

E N D
The Daya Bay Reactor Neutrino Experiment The Alignment Measurement for The Daya Bay Reactor Neutrino Detector Accelerator center of IHEP Luo tao 2010.9.12
Content 1.Introduction 2.Simulation 3.The alignment measurement with GPS 4.The data processing 5.Analysis 6.Conclusion
Introduction of the Alignment Measurement • The distance between neutrino detector and Daya bay reactor is measured in this survey. In this picture, the line is the outside control network for GPS survey
Simulation (1) • The simulation is based on Monte Carlo method. • There are two control points for tunnel entrance, six control points for the Daya bay reactor and one used for transferring in this GPS control network shown in fig.1. • The red ellipses represent the error circles after simulation such as shown in fig.2. 1 2
Simulation (2) • The detail results for correcting value and error ellipse (unit: mm) • Name MX MY MP E F • M5 3.76 3.96 5.46 4.01 3.7 • M9 4.59 4.70 6.57 4.78 4.5 • P1 3.63 3.79 5.25 3.94 3.46 • P2 4.27 3.84 5.74 4.37 3.73 • P3 4.68 4.71 6.64 4.87 4.52 • P4 4.9 4.87 6.91 4.91 4.87 • P5 5.07 5.23 7.29 5.24 5.07 • P6 5.17 5.31 7.41 5.36 5.12
Simulation (3) • The GPS receiver is used in this simulation. Rang precision is 5mm+2ppm, angle precision is 1.6 sec • Conclusion: high precision can be achieved through this scheme, superior to 10 mm
The Alignment Measurement with GPS (1) • The GPS survey experiment under the high voltage wire (220 KV) has shown that it could be feasible. etc
The alignment measurement with GPS (2) • There are some compared baselines measured by both GPS receivers and total-stations under the high voltage wire as well as others (launch tower, near building) • Small difference has been discovered after comparison between both method, measurements with GPS receivers are not effected. • The distance between GPS receivers and building depends on the heights of building (e.g. 5 meters away from 20-meter-high building, almost 15 degree’s altitude angle)
The Alignment Measurement with GPS (3) • 4 GPS receivers are applied in this alignment, Topcon and Sokkia • Every tunnel entrance and two reactor core has 4 GPS control points, and 4 extra control points are only used to transfer. • The 2-hour observations have been done at tunnel entrance, as well as reactor core. Then the others is totally 4-hours.
The alignment measurement with GPS (4) • The GPS observation shown in fig.1.2, and the measurement scheme shown in fig.3 1 3 2
The Data Processing (1) • The data preprocessing • The GPS measurement is based on its antenna phase center, and could be transferred to the marked points or the forced centering observation stand by slant height or vertical height which is measured like fig.1.2. 1 2
The Data Processing (2) 1 • The GPS baseline calculation • The GPS baseline is a 3-D coordinate difference every two GPS receivers by difference measuring such as fig.1 • There are several kinds of difference measuring like fig.2 2
The Data Processing (3) • The statistical results for GPS baseline calculation • The RMS (root mean square) is a entire precision index like formula.2,“f” is a number for redundant observations. • The RATIO is a ratio with the minimum RMS and weak minimal RMS, and should be more than 1. • The reference variable should be 1 when the adjusted data is consistent with site observations. 1 2
The Data Processing (4) • The error of closure • The GPS loop includes the simultaneous loop and the asynchronous loop. • The simultaneous loop composes of GPS baseline measured at the same time, and asynchronous loop is not all measured . • It is important for asynchronous loop closure to check the GPS observation error, setting point error and etc.
The Data Processing (5) • The statistical results for GPS closure error
The Data Processing (6) • The unrestrained adjustment • This adjustment can just decide the geometry of GPS control network, and should not change its scale and azimuth. • It only depends on the GPS baseline for that GPS control network precision
The Data Processing (7) • The constraint adjustment • The known data should be introduced into this constraint adjustment after unrestrained adjustment. So the data could change the GPS control network’s scale and azimuth as it is enough • Firstly the fundamental known data could determine the network in WGS84 (World Geodesic System). Then the control network should be transferred to on the Geoid by precise triangle levelling results.
The Data Processing (8) • The statistical results for adjustment in the WGS 84
The Data Processing (9) • The precise triangle levelling measurement • It’s feasible and valuable to replace the first order levelling by precise triangle levelling surveying shown as fig.1. • It’s measured like formula.1, • “R” - the average earth radius, • “k” - the atmospheric dioptre, • “p” - the spherical aberration correction, • “r” - the atmospheric dioptre correction. 1 1
The Data Processing (10) • The value’s effect of ‘p’ and ‘r’ could almost be offset by reciprocal observation at the same time. • The following is some experimental contrasting results between precise triangle levelling and geometric levelling shown as table in addition. • The value with ‘*’ means the average length of closing graphic.
The Data Processing (11) • The black line is constraint condition with precise triangle levelling height, the red line will be used to check the results that have been transferred on to the Geoid.
The Data Processing (12) • The GPS network is transferred by the black lines. The red line will check it and the results is shown as below. • The distal GPS network’s precision is better than 10mm
The Analysis • 1. The GPS data processing has a good precision. • 3-D precision: mm • 2. The results of precise triangle levelling is close to the geometric levelling, so it may replace the first order levelling as the conditions are enough. • 3. The GPS coordinate in WGS84 could be transferred on to the Geoid by the precise triangle levelling, and this transferred results is better than 10mm.
The Conclusion (1) • 1. The precision of GPS control network in the Daya Bay reactor neutrino’s alignment is better than 10mm in 3-D coordinate system (almost plane: 1mm height: 7mm). • 2. The precise triangle levelling is good enough to substitute for the first order levelling as that conditions are enough • 3. The data in WGS84 could be transferred on to the Geoid by height from precise triangle levelling.
The Conclusion (2) • Proposals on the alignment • 1. The 3-D distance could be calculated by both the same coordinate system and analysis method. • 2. The precise triangle levelling experiment are enough to get a comprehensive results comparing with the geometric levelling. • 3. This conditions which should transfer it on to the Geoid could expand to large area.