Download

1 / 11
0 likes | 10 Views
In the December 2023 monthly crime report of Districts 5 and 2 in St. Louis, notable details include varying crime rates across neighborhoods, with Forest Park Southeast experiencing an increase in total crimes but a decrease in crimes against persons compared to the previous year. Central West End saw a decrease in total crimes, particularly crimes against persons. District 5 had an average crime rate of 1218.2, while District 2 had a rate of 867 per 100,000 residents. The report provides insights on crime trends over time, highlighting specific neighborhoods and their respective statistics.

E N D
December 2023 Monthly Crime Report FOREST PARK SOUTHEAST CENTRAL WEST END Washington University Medical Center

CITY OF ST LOUIS POLICE DISTRICTS 6 Central West End Neighborhood 5 WUMC 4 Forest Park Southeast Neighborhood 2 3 1

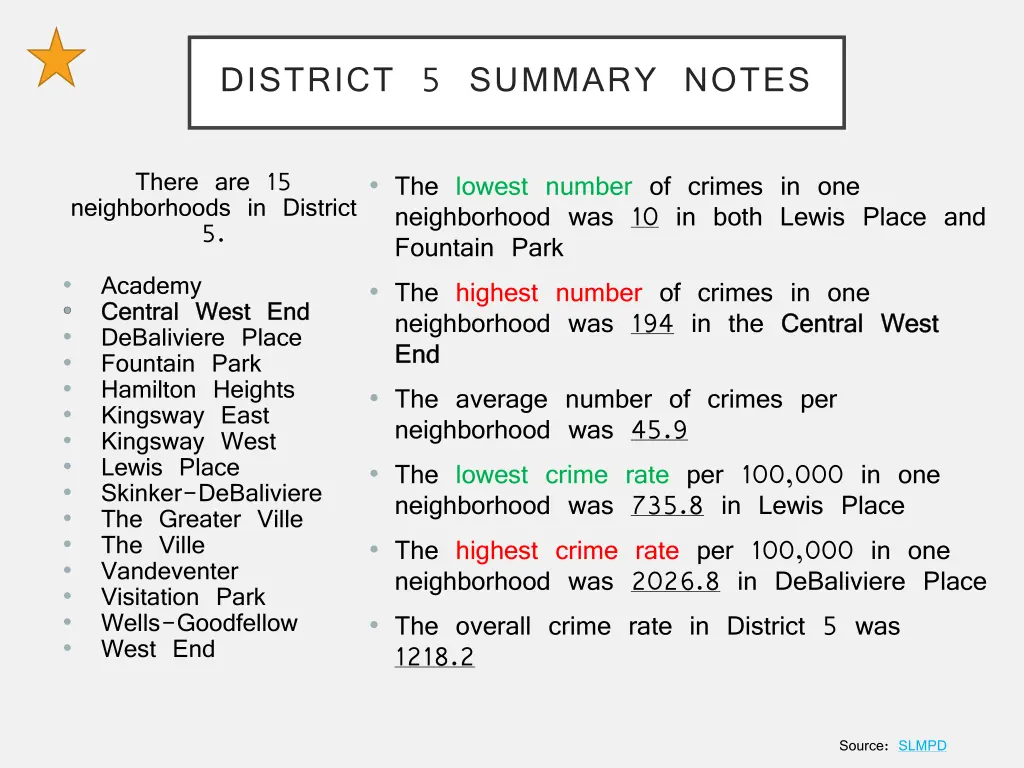
DISTRICT 5 SUMMARY NOTES There are 15 neighborhoods in District 5. • The lowest number of crimes in one neighborhood was 10 in both Lewis Place and Fountain Park • The highest number of crimes in one neighborhood was 194 in the Academy • DeBaliviere Place Fountain Park Hamilton Heights Kingsway East Kingsway West Lewis Place Skinker-DeBaliviere The Greater Ville The Ville Vandeventer Visitation Park Wells-Goodfellow West End • • • • • • • • • • • • • • The average number of crimes per neighborhood was 45.9 • The lowest crime rate per 100,000 in one neighborhood was 735.8 in Lewis Place • The highest crime rate per 100,000 in one neighborhood was 2026.8 in DeBaliviere Place • The overall crime rate in District 5 was 1218.2 Source: SLMPD
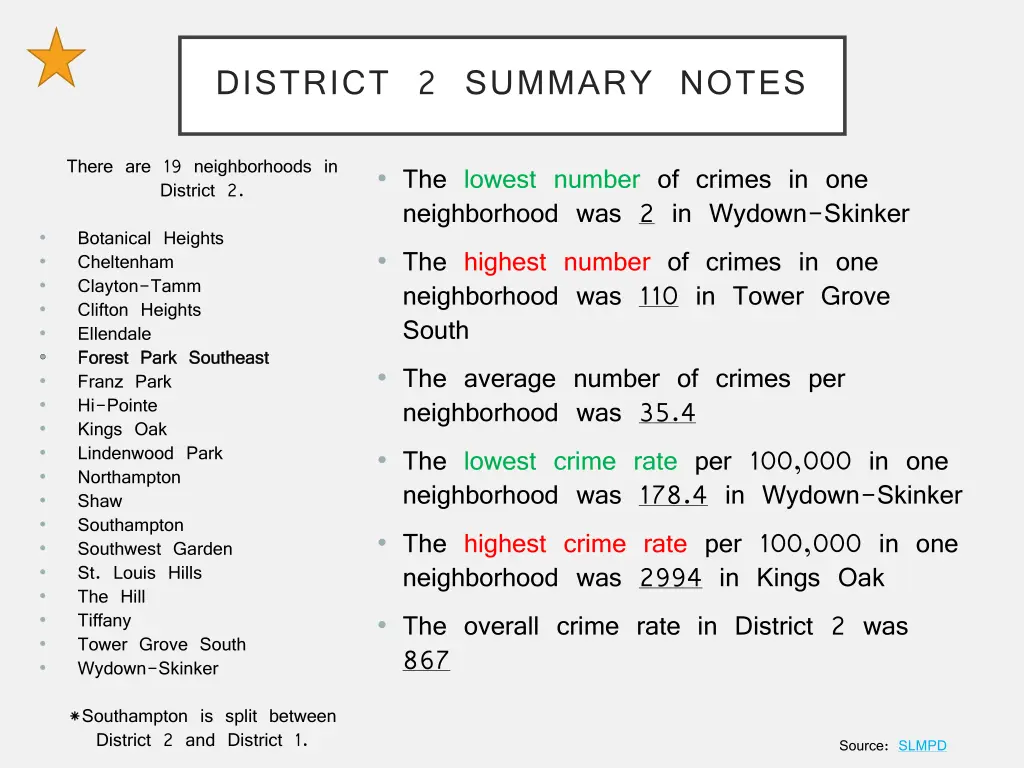
DISTRICT 2 SUMMARY NOTES There are 19 neighborhoods in District 2. • The lowest number of crimes in one neighborhood was 2 in Wydown-Skinker • The highest number of crimes in one neighborhood was 110 in Tower Grove South • The average number of crimes per neighborhood was 35.4 • The lowest crime rate per 100,000 in one neighborhood was 178.4 in Wydown-Skinker • The highest crime rate per 100,000 in one neighborhood was 2994 in Kings Oak • The overall crime rate in District 2 was 867 Botanical Heights Cheltenham Clayton-Tamm Clifton Heights Ellendale • • • • • Franz Park Hi-Pointe Kings Oak Lindenwood Park Northampton Shaw Southampton Southwest Garden St. Louis Hills The Hill Tiffany Tower Grove South Wydown-Skinker • • • • • • • • • • • • • *Southampton is split between District 2 and District 1. Source: SLMPD
NEIGHBORHOODS VS CITY CRIME RATE OVER TIME 4000 3500 3000 Crime Rate per 100,000 Residents 2500 2000 1500 1000 500 0 Dec-22 Jan-23 Feb-23 Mar-23 Apr-23 May-23 Time of the Year Jun-23 Jul-23 Aug-23 Sep-23 Oct-23 Nov-23 Central West End Crime Rate Forest Park Southeast Crime Rate City Crime Rate

FOREST PARK SOUTHEAST NEIGHBORHOOD DETAIL

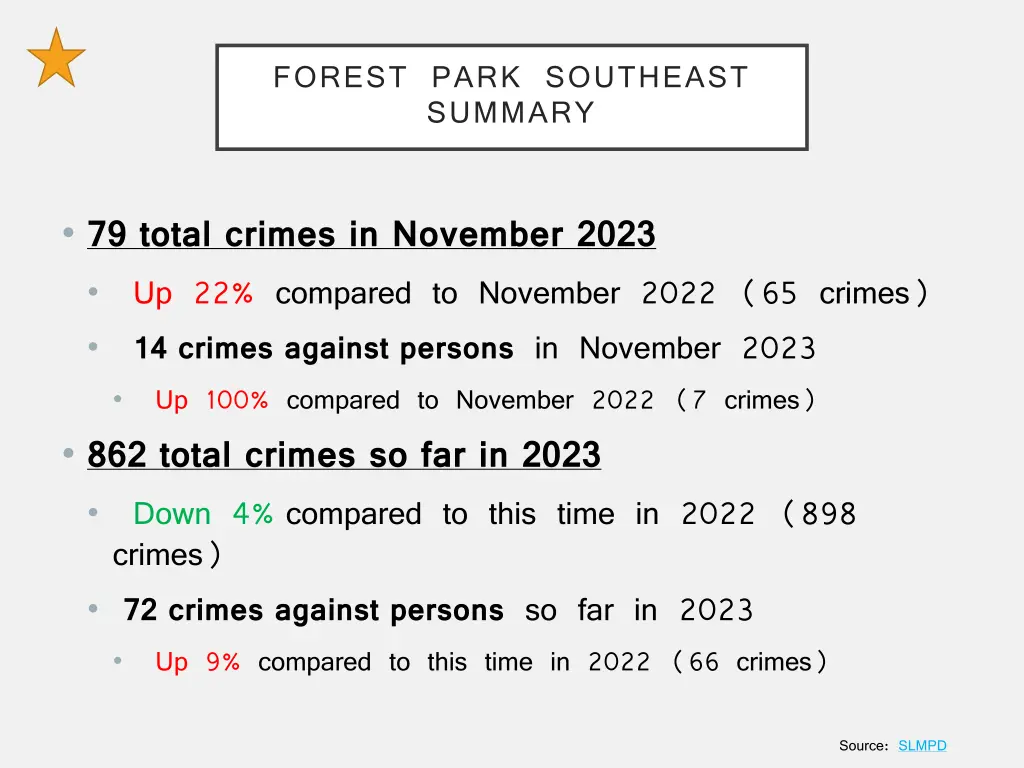
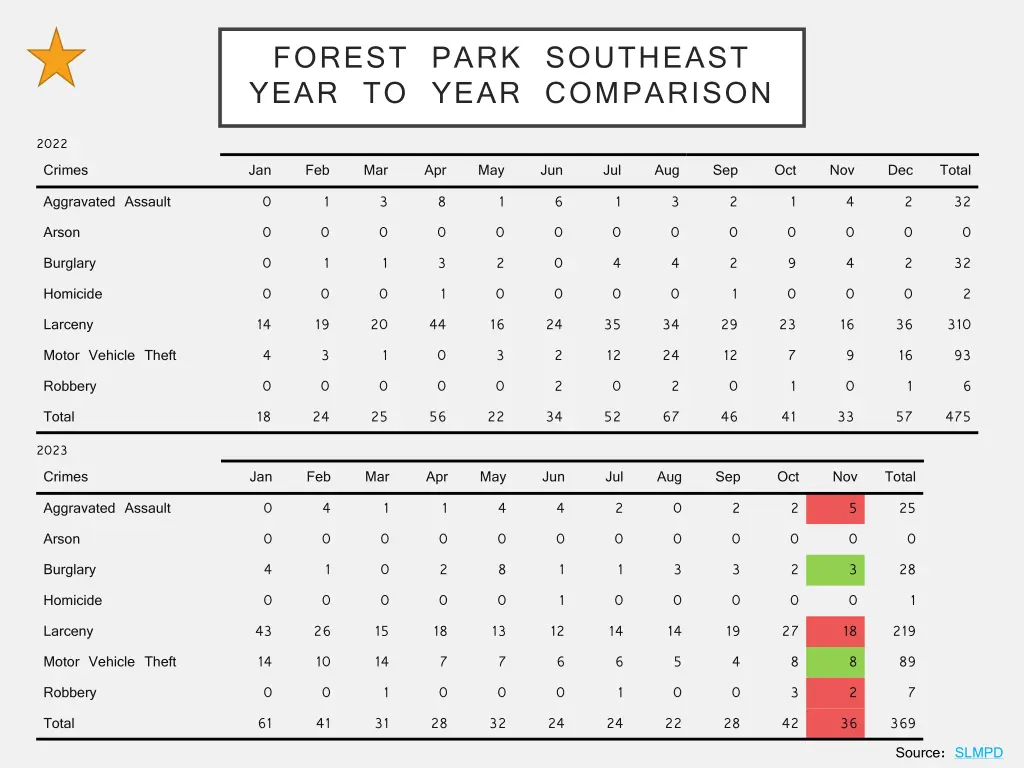
FOREST PARK SOUTHEAST SUMMARY • 79 total crimes in November 2023 • Up 22% compared to November 2022 (65 crimes) • 14 crimes against persons in November 2023 • Up 100% compared to November 2022 (7 crimes) • 862 total crimes so far in 2023 • Down 4% compared to this time in 2022 (898 crimes) • 72 crimes against persons so far in 2023 • Up 9% compared to this time in 2022 (66 crimes) Source: SLMPD
FOREST PARK SOUTHEAST YEAR TO YEAR COMPARISON 2022 Crimes Jan Feb Mar Apr May Jun Jul Aug Sep Oct Nov Dec Total Aggravated Assault 0 1 3 8 1 6 1 3 2 1 4 2 32 Arson 0 0 0 0 0 0 0 0 0 0 0 0 0 Burglary 0 1 1 3 2 0 4 4 2 9 4 2 32 Homicide 0 0 0 1 0 0 0 0 1 0 0 0 2 Larceny 14 19 20 44 16 24 35 34 29 23 16 36 310 Motor Vehicle Theft 4 3 1 0 3 2 12 24 12 7 9 16 93 Robbery 0 0 0 0 0 2 0 2 0 1 0 1 6 Total 18 24 25 56 22 34 52 67 46 41 33 57 475 2023 Crimes Jan Feb Mar Apr May Jun Jul Aug Sep Oct Nov Total Aggravated Assault 0 4 1 1 4 4 2 0 2 2 5 25 Arson 0 0 0 0 0 0 0 0 0 0 0 0 Burglary 4 1 0 2 8 1 1 3 3 2 3 28 Homicide 0 0 0 0 0 1 0 0 0 0 0 1 Larceny 43 26 15 18 13 12 14 14 19 27 18 219 Motor Vehicle Theft 14 10 14 7 7 6 6 5 4 8 8 89 Robbery 0 0 1 0 0 0 1 0 0 3 2 7 Total 61 41 31 28 32 24 24 22 28 42 36 369 Source: SLMPD
CENTRAL WEST END NEIGHBORHOOD DETAIL

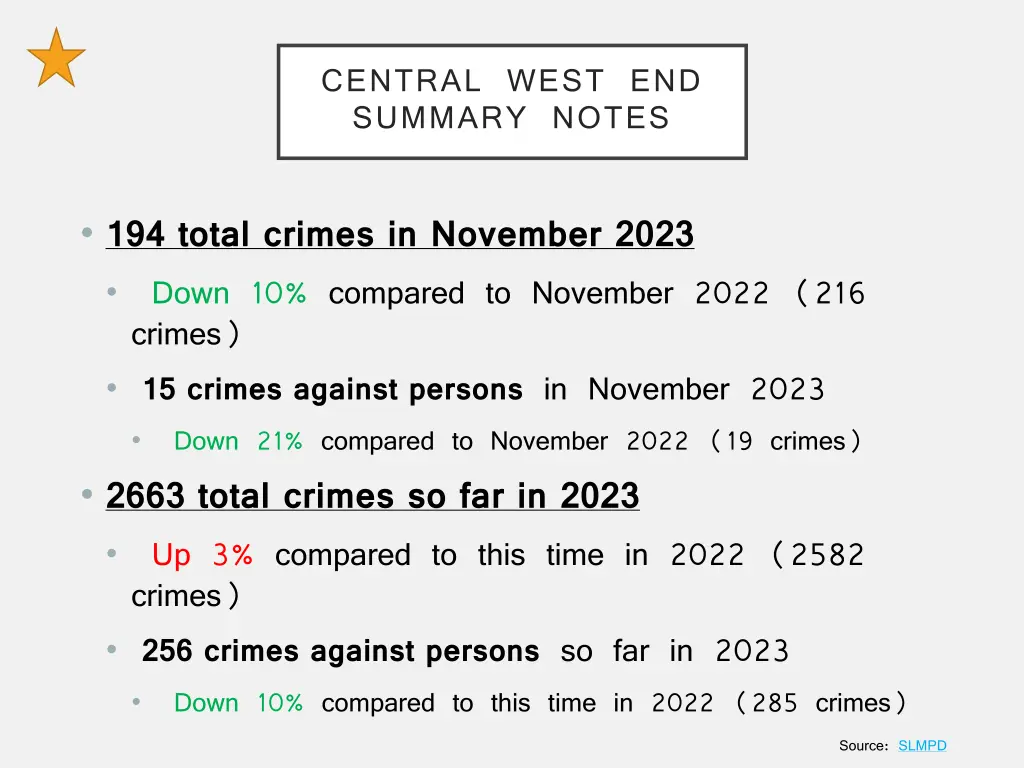
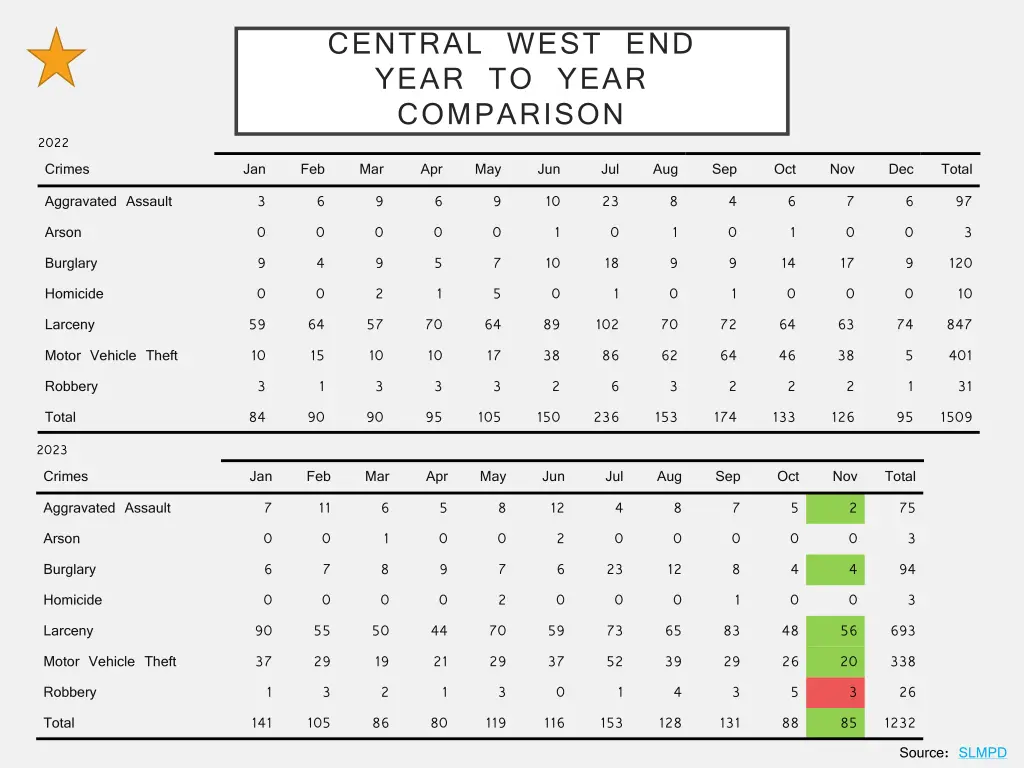
CENTRAL WEST END SUMMARY NOTES • 194 total crimes in November 2023 • Down 10% compared to November 2022 (216 crimes) • 15 crimes against persons in November 2023 • Down 21% compared to November 2022 (19 crimes) • 2663 total crimes so far in 2023 • Up 3% compared to this time in 2022 (2582 crimes) • 256 crimes against persons so far in 2023 • Down 10% compared to this time in 2022 (285 crimes) Source: SLMPD
CENTRAL WEST END YEAR TO YEAR COMPARISON 2022 Crimes Jan Feb Mar Apr May Jun Jul Aug Sep Oct Nov Dec Total Aggravated Assault 3 6 9 6 9 10 23 8 4 6 7 6 97 Arson 0 0 0 0 0 1 0 1 0 1 0 0 3 Burglary 9 4 9 5 7 10 18 9 9 14 17 9 120 Homicide 0 0 2 1 5 0 1 0 1 0 0 0 10 Larceny 59 64 57 70 64 89 102 70 72 64 63 74 847 Motor Vehicle Theft 10 15 10 10 17 38 86 62 64 46 38 5 401 Robbery 3 1 3 3 3 2 6 3 2 2 2 1 31 Total 84 90 90 95 105 150 236 153 174 133 126 95 1509 2023 Crimes Jan Feb Mar Apr May Jun Jul Aug Sep Oct Nov Total Aggravated Assault 7 11 6 5 8 12 4 8 7 5 2 75 Arson 0 0 1 0 0 2 0 0 0 0 0 3 Burglary 6 7 8 9 7 6 23 12 8 4 4 94 Homicide 0 0 0 0 2 0 0 0 1 0 0 3 Larceny 90 55 50 44 70 59 73 65 83 48 56 693 Motor Vehicle Theft 37 29 19 21 29 37 52 39 29 26 20 338 Robbery 1 3 2 1 3 0 1 4 3 5 3 26 Total 141 105 86 80 119 116 153 128 131 88 85 1232 Source: SLMPD


![[Epub] We Own This City: A True Story of Crime, Cops and Corruption in Baltimore Full](https://cdn5.slideserve.com/11101399/slide1-dt.jpg)


![Secure 100% Exam Results with SAP C-TS4C-2023 Practice Questions [2023]](https://cdn7.slideserve.com/12266919/sap-c-ts4c-2023-dt.jpg)