Download
1 / 3
30 likes | 44 Views
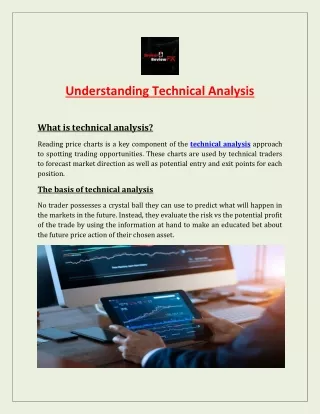
Reading price charts is a key component of the technical analysis approach to spotting trading opportunities. These charts are used by technical traders to forecast market direction as well as potential entry and exit points for each position.

E N D
Understanding Technical Analysis What is technical analysis? Reading price charts is a key component of the technical analysis approach to spotting trading opportunities. These charts are used by technical traders to forecast market direction as well as potential entry and exit points for each position. The basis of technical analysis No trader possesses a crystal ball they can use to predict what will happen in the markets in the future. Instead, they evaluate the risk vs the potential profit of the trade by using the information at hand to make an educated bet about the future price action of their chosen asset.
Technical traders believe that a market's price chart has all the information necessary to predict the market's future direction. Key concepts of technical analysis There are hundreds of trading tools that a technical trader can utilize, but it all boils down to identifying support and resistance, trends, and ranges. Support and resistance Support and resistance are areas on a market’s chart that it has difficulty breaking past. If a market reaches its support or resistance level, then a price reversal may be on the cards. Trends and ranges Markets can only be in three states: An uptrend, when prices are rising overall A downtrend, when prices are falling overall A range, when prices are stuck between support and resistance By using indicators and patterns, technical traders aim to spot when new trends are forming. Technical analysis vs fundamental analysis Technical analysis is one of the two main ways in which traders analyze the market; the other is fundamental analysis. They represent very different methods for assessing assets and finding new positions.
Technical analysis involves looking purely at market prices and patterns, ignoring all other data Fundamental analysis involves researching what is driving market price action, taking earnings, economic data, and more into account. ________________________________________