Download
1 / 17
180 likes | 266 Views
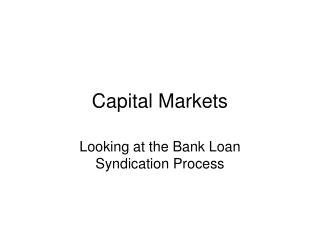
GETINGE CAPITAL MARKETS DAY. Ulf Grunander, CFO Boston 31 st of January, 2012. Cash Flow 2011. Cash conversion target achieved. Strong operating cash flow in Q4. Continued reduction in average Working Capital. 2. Cash conversion in target range. Target range : 60 – 70%. 3.

E N D
GETINGE CAPITAL MARKETS DAY Ulf Grunander, CFO Boston 31st of January, 2012
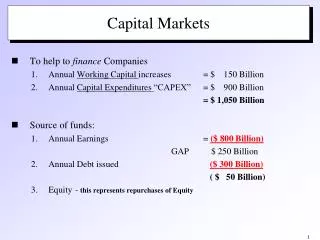
Cash Flow 2011 Cash conversion target achieved Strong operating cash flow in Q4 Continued reduction in average Working Capital 2
Cash conversion in target range Target range: 60 – 70% 3
Key Operating Cash Flow drivers • Active product portfolio management and shift in product mix • Manufacturing consolidation and successful lean projects in Operations positively impacting inventory & Accounts Payable • Successful logistics programs • Improved inventory efficiency in Service and Installation • Order to Cash projects reducing Accounts Receivable, DSO and external financial lead times • Increased activities across all Business Areas in Accounts Receivable collection 4
Operating cash flow (MSEK) • Comments • Solid cash flow development in Q4 2011 +31,2% vs. Q4 LY • Sales growth of 10,7% in Q4 2011 vs. Q4 LY • Strong profit performance in Q4 2011 EBITDA + 20% vs. Q4 LY 5
Working Capital Development Average WCap (bars) MSEK WCap Days (line) Days • Comments • Continued Working Capital progress despite challenging environment • Working Capital development [SEK] : • Inventory: -120 m • A/R: -130 m • A/P: - 30 m • Total -220 m • Committed efforts in 2012 to render further Working Capital improvements in 300 – 400 MSEK range * Growth adjusted
Capital Expenditure (Capex) 3.5% 4.0% 3.5% 3.2% 3.0% 915 766 667 659 521 Gross Net 7
Net debt 8
Interest bearing financial liabilities as of December 31, 2011 9
Maturity of debts Nov Nov Nov Nov October July July July June June Nov May December
Currency exposure 2012 Currency rates used for group estimates 2012 USD 6.85 EUR 8.80 GBP 10.55 JPY 8.95 Currency exposure at 5% change in currency rates, MSEK +/- 70 +/- 45 +/- 30 +/- 5 Net remaining currency exposure volumes in 2012, million USD 210 EUR 100 GBP 60 JPY 1 300 15
Tax rate 16