Download
1 / 58
580 likes | 604 Views
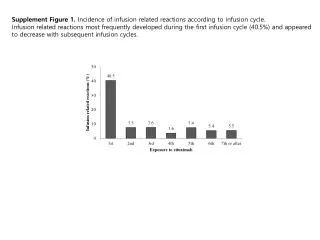
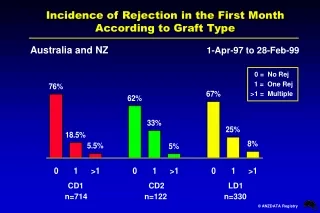
Incidence of Rejection in the First Month According to Graft Type. Australia and NZ 1-Apr-97 to 28-Feb-99. 0 = No Rej 1 = One Rej >1 = Multiple. CD1 CD2 LD1 n=714 n=122 n=330.

E N D
Incidence of Rejection in the First MonthAccording to Graft Type Australia and NZ 1-Apr-97 to 28-Feb-99 0 = No Rej 1 = One Rej >1 = Multiple CD1 CD2 LD1 n=714 n=122 n=330
Cadaver and Living Donor TransplantsAustralia 1991 - 1998 Number of Transplants
Rate of Transplantation 1998 Related to Patients Dialysed All Patients
Rate of Transplantation 1998 Related to Patients Dialysed Patients - Age Group 15-59 Years
Rate of Transplantation 1998 Related to Population (Per Million) Australian States No. Grafts 98 153 118 14 73 11 49 516 107 Thirteen Tasmanian residents transplanted in Vic, one in NSW Ten NT residents transplanted in SA, one in QLD One New Zealand patient transplanted in NSW
Transplant Operations (Per Million) 1998 Australia No. Tx 6 15 46 97 121 131 85 16
Transplant Operations (Per Million) 1998 New Zealand No. Tx 1 3 10 25 15 27 16 9
Rate of Transplantation 1998 Related to Patients Dialysed Australia 7.4%
Rate of Transplantation 1998 Related to Patients Dialysed New Zealand 7.5%
New Transplanted Patients 1998 Related to Race and Age Group Australia Aboriginal (n=28)
New Transplanted Patients 1998 Related to Race and Age Group Australia Asian (n=37)
New Transplanted Patients 1998 Related to Race and Age Group Australia Caucasoid (n=433)
New Transplanted Patients 1998 Related to Race and Age Group New Zealand Maori (n=17)
New Transplanted Patients 1998 Related to Race and Age Group New Zealand Pacific Islander (n=7)
New Transplanted Patients 1998 Related to Race and Age Group New Zealand Caucasoid (n=77)
AUST27 27 26 25 24 26 27 28 NZ 22 33 24 23 26 26 30 28 Transplant Operations 1991 - 1998 Per Million Population Australian States
Primary Cadaver Patient Survival 1991 - 1997 Related to Year of Transplant Australia Patient Survival
Primary Cadaver Graft Survival 1991 - 1997 Related to Year of Transplant Australia Graft Survival
Primary Cadaver Patient Survival 1991 - 1997 Related to Year of Transplant New Zealand Patient Survival
Primary Cadaver Graft Survival 1991 - 1997 Related to Year of Transplant Graft Survival New Zealand
Second and Subsequent Cadaver Patient Survival Related to Years of Transplant 1984 - 1998 Patient Survival Australia Years
Second and Subsequent Cadaver Graft Survival Related to Years of Transplant 1984 - 1998 Graft Survival Australia Years
Age Related Proportion of OperationsLiving Donor Grafts: Australia 1994/1998 Percentage of Transplants
Proportion of Operations - Living Donor GraftsStates: Australia and New Zealand Age Group 25-44 Years
Australian Transplantation 1991 - 1998 12 month graft survival CD1 84 86 85 91 90 89 89
New Zealand Transplantation 1991 - 1998 12 month graft survival CD1 82 80 74 75 84 84 85
Functioning Transplants 1991 - 1998Transplanting States: Australia and NZ Patients Per Million No. Pats 1998 939 1676 1287 583 395 4880 934
Functioning Transplants 1991 - 1998 Per Million Population Transplanting States AUST 201 210 218 227 233 241 251 260 NZ 174 191 198 203 214 221 234 246
Age Group Dependence on Functioning Transplants - Australia 1998 Transplants (4880) Total RRT (10403) (18) (108) (378) (1094) (1709) (2168) (2234) (2024) (648) (22)
Age Group Dependence on Functioning Transplants - New Zealand 1998 Transplants (934) Total RRT (2051) (3) (31) (87) (247) (403) (464) (457) (294) (62) (3)
Age Distribution of Functioning Transplants Australia 1998 Transplants (n=4880)
Age Distribution of Functioning Transplants Australia 1998 Per Million (260)
Age Distribution of Functioning Transplants New Zealand 1998 Transplants (n=934)
Age Distribution of Functioning Transplants New Zealand 1998 Per Million (246)
Number and Duration of Functioning GraftsCaring Country - Australia 1998 All Functioning Grafts (4897)
Number and Duration of Functioning GraftsCaring Country - New Zealand 1998 All Functioning Grafts (917)
Functioning Transplant Patients 1998Related to Race and Age Group Australia Aboriginal (n=101)
Functioning Transplant Patients 1998Related to Race and Age Group Australia Asian (n=274)
Functioning Transplant Patients 1998Related to Race and Age Group Australia Caucasoid (n=4422)
Functioning Transplant Patients 1998Related to Race and Age Group New Zealand Maori (n=94)
Functioning Transplant Patients 1998Related to Race and Age Group New Zealand Pacific Islander (n=41)
Functioning Transplant Patients 1998Related to Race and Age Group New Zealand Caucasoid (n=750)
Incidence of Rejection in the First MonthAccording to Graft Type Australia and NZ 1-Apr-97 to 28-Feb-99 0 = No Rej 1 = One Rej >1 = Multiple CD1 CD2 LD1 n=714 n=122 n=330
Incidence of Rejection in the First MonthAccording to Recipient Age Australia and NZ 1-Apr-97 to 28-Feb-99 CD1 0 = No Rej 1 = One Rej >1 = Multiple Ab = Requiring OKT3/ALG/ATG 0-29 yrs 30-54 yrs 55 yrs n=105 n=406 n=203
Incidence of Rejection in the First MonthAccording to Total Ischaemia Time Australia and NZ 1-Apr-97 to 28-Feb-99 CD1 0 = No Rej 1 = One Rej >1 = Multiple Ab = Requiring OKT3/ALG/ATG <18 hours >18 hours n=477 n=227
Incidence of Rejection in the First MonthAccording to Delayed Graft Function Australia and NZ 1-Apr-97 to 28-Feb-99 CD1 0 = No Rej 1 = One Rej >1 = Multiple Ab = Requiring OKT3/ALG/ATG Delayed Function Immediate Function n=153 n=561
Incidence of Rejection in the First MonthAccording to HLA - DR Mismatches Australia and NZ 1-Apr-97 to 28-Feb-99 CD1 0 = No Rej 1 = One Rej >1 = Multiple Ab = Requiring OKT3/ALG/ATG 0 MM 1 MM 2 MM n=271 n=268 n=175
Incidence of Rejection in the First MonthAccording to HLA - A, B Mismatch Australia and NZ 1-Apr-97 to 28-Feb-99 CD1 0 = No Rej 1 = One Rej >1 = Multiple Ab = Requiring OKT3/ALG/ATG 0-2 AB MM 3-6 AB MM n=178 n=536
Incidence of Rejection in the First MonthAccording to HLA - A,B, DR Mismatch Australia and NZ 1-Apr-97 to 28-Feb-99 CD1 0 = No Rej 1 = One Rej >1 = Multiple Ab = Requiring OKT3/ALG/ATG 0,1,2 Mismatch 3-6 Mismatch n=267 n=447
Incidence of Rejection in the First MonthAccording to use of CyA Sparing Agent Australia and NZ 1-Apr-97 to 28-Feb-99 CD1 0 = No Rej 1 = One Rej >1 = Multiple Ab = Requiring OKT3/ALG/ATG CyA Sparing No CyA Sparing n=376 n=338