Download
1 / 14
160 likes | 404 Views
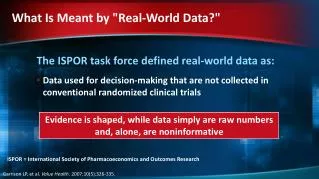
What Is Meant by "Real-World Data?". The ISPOR task force defined real-world data as: Data used for decision-making that are not collected in conventional randomized clinical trials. Evidence is shaped, while data simply are raw numbers and, alone, are noninformative.

E N D
What Is Meant by "Real-World Data?" • The ISPOR task force defined real-world data as: • Data used for decision-making that are not collected in conventional randomized clinical trials Evidence is shaped, while data simply are raw numbers and, alone, are noninformative ISPOR = International Society of Pharmacoeconomics and Outcomes Research Garrison LP, et al. Value Health. 2007;10(5):326-335.
Limitations of Randomized Clinical Trials Real-world observational Traditional interventional Pragmaticclinical trial Randomized controlled trial Prospective observational study Retrospective observational study • Patients treated according to the protocol • Actual care that patients receive in clinical practice • Extensive inclusion and exclusion criteria • All patients must be treated, including those with comorbidities Garrison LP, et al. Value Health. 2007;10(5):326-335; Nallamothu BK, et al. Circulation. 2008;118(12):1294-1303.
Limitations of Randomized Clinical Trials Real-world observational Traditional interventional Pragmaticclinical trial Randomized controlled trial Prospective observational study Retrospective observational study • Patients treated according to the protocol • Actual care that patients receive in clinical practice • Extensive inclusion and exclusion criteria • All patients must be treated, including those with comorbidities • Endpoints are efficacy and safety over a predetermined time period • Longer-term efficacy and safety data + economic assessments under typical clinical conditions Garrison LP, et al. Value Health. 2007;10(5):326-335; Nallamothu BK, et al. Circulation. 2008;118(12):1294-1303.
Limitations of Randomized Clinical Trials Real-world observational Traditional interventional Pragmaticclinical trial Randomized controlled trial Prospective observational study Retrospective observational study • Patients treated according to the protocol • Actual care that patients receive in clinical practice • Extensive inclusion and exclusion criteria • All patients must be treated, including those with comorbidities • Endpoints are efficacy and safety over a predetermined period of time • Longer-term efficacy and safety data + economic assessments under typical clinical conditions • Compare treatment against the standard of care (eg, interferon or glatiramer acetate) • Possible to compare multiple interventions Garrison LP, et al. Value Health. 2007;10(5):326-335; Nallamothu BK, et al. Circulation. 2008;118(12):1294-1303.
Sources of Real-World Data • Pragmatic clinical trials • Prospective observational studies and patient registries • Administrative claims data • Patient surveys • Electronic health records/medical chart reviews • Government- or third-party-sponsored systematic surveys that assess public health, resource consumption, practice patterns, and clinical trends Garrison LP, et al. Value Health. 2007;10(5):326-335.
Clinical and Post-Marketing Experience With Oral Therapies • IMS Health. Gilenya Unique Patient Exposures. 2014. Data on file. • Henson LJ, et al. CMSC-ACTRiMS 2014. Abstract DX41. • http://www.tecfidera.com/pdfs/full-prescribing-information.pdf
PANGAEA: Documentation of Fingolimod Treated Patients in a Registry • Noninterventional registry study for prospective compilation of long-term data on safety and efficacy of fingolimod • 4000 patients with RRMS from neurological clinics and practices throughout Germany • Recruitment was completed at the end of 2012 • Safety and efficacy data will be collected over 5-year observation period • Pharmacoeconomic data in 800 patients will be collected for 2 years • Designed according to the Risk Management Plan of the EMA PANGAEA Observational phase End ofTreatment Baseline Fingolimod 0.5 mg, n=4000 Enrolment of patients EMA = European Medicines Agency; RRMS = relapsing-remitting multiple sclerosis Ziemssen T, et al. ECTRiMS 2012. Abstract P522.
PANGAEA 24-Month Interim Results: ARR by Previous Therapy ARR = annualized relapse rate; IFN = interferon Ziemssen T, et al. AAN 2014. Abstract P3.152.
Days Off Treatment: Adherence With Fingolimod During the last 14 days, how often did you not take your medication? Number of Days Off Treatment During Last 14 Days A comparison between PANGAEA and PEARL shows better compliance on fingolimod than on first-line therapy. DMT = disease-modifying therapy Ziemssen T, et al. ECTRIMS 2012. Abstract P302.
MSBase –Fingolimod vs BRACE Therapies: Study Overview[a] Objective: Assess comparative effectiveness on time to first relapse and to treatment discontinuation in patients with a history of relapses and switching from a BRACE therapy (IFN-β or glatiramer acetate) to fingolimod or another BRACE therapy Propensity scores* were used to create balanced cohorts of patients Patients switching from a BRACE therapy to either fingolimod or another BRACE therapy, with at least one relapse in the prior 12 months (n=518) BRACE cohort(n=243) Fingolimod cohort(n=275) Unmatched cohorts 1:1 propensity matching of patient characteristics: sex, age, disease duration, EDSS score, pre-baseline treatment and relapse activity Matched cohorts BRACE cohort(n=208) Fingolimod cohort(n=208) *Propensity score matching is a statistical technique used to match patients in observational studies[b] BRACE = betaferon, rebif, avonex, copaxone, extavia; EDSS = expanded disability status scale; IFN-β =interferon beta a. Spelman T, et al. ECTRiMS 2013. Abstract P1096. b. Rosenbaum PR and Rubin DB. Biometrika 1983;70:41–55.
MSBASE – Fingolimod vs BRACE Therapies: Proportion of Patients Not Relapsed After Switching In patients with a history of relapses on BRACE treatment, fingolimod reduced the relapse rate compared with BRACE therapies. Time to first relapse and corresponding risk reduction over 12 months in patients with history of relapse on DMT treatment* 45%reduction vs BRACE (P < .01)* *Study cohorts were restricted to patients who switched from a BRACE therapy to either fingolimod or to (another) BRACE therapy and had at least 1 relapse in the prior 12 months or at least 2 in the prior 24 months. Spelman T, et al. ECTRiMS 2013. Abstract P1096.
MSBASE – Fingolimod vs BRACE Therapies: Discontinuation Rate After Switching In patients with a history of relapses on DMT treatment, fingolimod reduced the risk of discontinuing treatment compared to BRACE therapies Time to discontinuation and corresponding risk reduction over 12 months in patients with history of relapse on DMT treatment* 78%reduction vs BRACE (P< .01)* *Study cohorts were restricted to patients who switched from a BRACE therapy to either fingolimod or to (another) BRACE therapy and had at least 1 relapse in the prior 12 months or at least 2 in the prior 24 months. Spelman T, et al. ECTRiMS 2013. Abstract P1096.
MSBASE – Real-World Data Comparing Natalizumab vs BRACE Therapies: Study Overview "Stay or Go" analysis of 2 data sets using propensity matching All MSBase TOP Patients 3976 694 4670 Original sample • Selection criteria: • Patients on any BRACE therapy who had experienced on-treatment relapse during the prior 12 months and who: • Continued their BRACE therapy or • Switched to natalizumab 3821 694 4515 Satisfying entry criteria Without missing values in the covariates 3743 694 4437 569 569 1138 Successfully matched Completeness of matching 569/694 = 82% TOP = Natalizumab Observational Program Spelman T, et al. AAN2013. Abstract P01.211.
MSBASE – Real-World Data Comparing Natalizumab vs BRACE Therapies: Proportion of Patients Not Relapsed Propensity Matched HR for BRACE vs natalizumab, 2.73; P <.001 Spelman T, et al. AAN2013. Abstract P01.211.