Download
1 / 69
730 likes | 902 Views
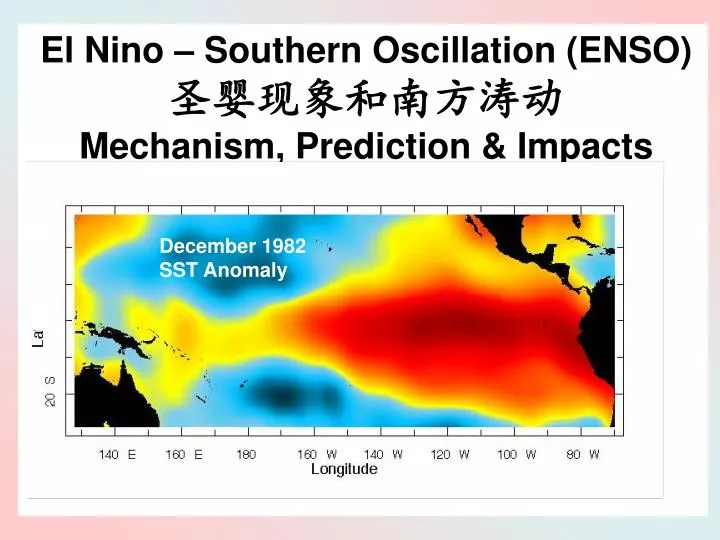
December 1982 SST Anomaly. El Nino – Southern Oscillation (ENSO) 圣婴现象和南方涛动 Mechanism, Prediction & Impacts. The white areas off the tropical coasts of South and North America indicate the pool of warm water.

E N D
December 1982 SST Anomaly El Nino – Southern Oscillation (ENSO)圣婴现象和南方涛动Mechanism, Prediction & Impacts
The white areas off the tropical coasts of South and North America indicate the pool of warm water
El Niño/La Niña-Southern Oscillation, or ENSO, is a quasiperiodic climate pattern that occurs across the tropical Pacific Ocean roughly every five years. • It is characterized by variations in the temperature of the surface of the tropical eastern Pacific Ocean—warming or cooling known as El Niño and La Niña respectively—and air surface pressure in the tropical western Pacific—the Southern Oscillation. • The two variations are coupled: the warm oceanic phase, El Niño, accompanies high air surface pressure in the western Pacific, while the cold phase, La Niña, accompanies low air surface pressure in the western Pacific. • Mechanisms that cause the oscillation remain under study.
ENSO normal state ● Normal equatorial winds warm as they flow westward across the Pacific ● Cold water is pulled up along west coast of South America ● Warming water is pushed toward west side of Pacific
El Niño state • Sea surface is warm in central and eastern Pacific • Less cold water is pulled up along west coast of South America • Hot air rises in central Pacific, travels east and west before cool
La Niña state • Warm water accumulates in far western Pacific. • Equatorial water is cooler than in the normal state
NINO3.4 NINO3 NINO3.4 = ENSO index, measuringaverage SST anomaly within box 5S-5N; 170W-120W
NINO3 (or NINO3.4) is measureof oceanic part of ENSO. Southern Oscillation Index* (SOI)is measure of atmospheric part of ENSO. These two indices are highly correlated. *Traditional Version: SOI = SLPTahiti - SLPDarwin (there’s also and equatorial version) Correlation > 0.9
Although they havesimilarities… ALL El Niño events are unique
Walker Circulation Mechanism - How it works: First understand the mean state Tropical Pacific – Average State
Coupled Behavior in tropical Pacific SST Winds Upper Ocean Gradient Structure (Thermocline)
Pacific Ocean Temperatures along Equator • Based on these observationsof equatorial temperatures: • Is eastern Pacific thermoclinedeeper or shallower thannormal? • What direction are thezonal wind anomalies? • Will eastern Pacific SSTsget warmer or colder? http://www.pmel.noaa.gov/tao/jsdisplay or http://www.tao.noaa.gov
What is the direct (i.e. oceanic) impact of El Niño events on CO2 variability?
“There is thus ample reason for a never-ending succession of alternating trends by air-sea interaction in the equatorial belt, but just how the turnabout between trends takes place is not yet quite clear.” J. Bjerknes 1969
Klaus Wyrti in early 1970sshows through observationsof sea level that changes inupper ocean structure arerelated to ENSO variability,that can influence the initiationof El Nino or transition betweenEl Nino and La Nina thoughocean dynamics Klaus Wyrtki Decrease of sea level = Thermocline rise A dynamical response NOT surface heating
Wind Anomaly applied for 30 days Warm SSTa Dynes/cm**2 Response of upper-ocean structure - Warm SSTa + - (Courtesy: Dave DeWitt, IRI)
Evolution of upper-ocean structure (or thermocline) anomalies Perturbations move eastwardon the equator; westwardoff the equator Perturbations move slower as latitude increases (Courtesy: Dave DeWitt)
Continuing Evolution of upper-ocean structure (or thermocline) anomalies Warm SSTa • At western boundary, • waves are reflected and • channeled onto equator • Delayed negative feedback Warm SSTa (Courtesy: Dave DeWitt)
Wind Stress a ThermoclineAnomalies Near peakEl Nino b c Transition(neutral) d Near peakLa Nina e
Main Points: • * The tropical Pacific air-sea system is coupled, with the pattern of SSTs, the low-level winds and the thermocline slope all dynamically connected • * El Nino & La Nina events result from coupled instability of the atmosphere/ocean system in the Tropical Pacific • Bjerknes Hypothesis of coupled growth + equatorial ocean dynamics • * Among the fruits of the Bjerknes hypothesis, with Wyrtki’s contribution… • ENSO events can be predicted • ENSO events have been predicted • The essence* of ENSO is understood • *The “linear essence” at least
Zebiak-Cane Intermediate Coupled Ocean-AtmosphereModel Atmosphere Part – Low-level winds convergetowards warmest SSTa,so atmospheric heating(SH & LH fluxes) areproportional to SSTa. This effect is amplified in regions where the meanSST is warm (mean convergence).
Zebiak-Cane Intermediate Coupled Ocean-AtmosphereModel Ocean Part – Very simplified ocean model(kind of like 2-layer fluid toy).Ekman transport in surfacelayer. Convergence or divergence in surface layerleads to changes in the depthof the thermocline, which sitsat base of upper layer.Temperature anomaly in thesub-surface is determinedby depth of the thermocline.
First Successful [Documented] El Niño Prediction After Cane, Zebiak and Dolan - Nature 1986 and see Barnett, Graham, Cane, Zebiak, Dolan, O’Brien and Legler, Science 1988 Contours at 0.5°C
Factors limiting the current skill of forecasts: • Model flaws • Flaws in the way the data is used (data assimilation and initialization) • Gaps in the observing system • Inherent limits to predictability
Some periods appear to bemore predictable than othersPrediction accuracy decreasesat longer lead-times. Chen, et al 2004 Nature
°C Example of Inherent Limit toPredictability Sensitivity toInitial Conditions
Another Exampleregarding inherent limits to predictability(and somewhat model flaws also) Evolution of the 2002-03 El Nino event compared to the 1997-98 El Nino event
“Signal” versus “Noise” issues ENSO is a slowly varying coupled ocean-atmospherephenomenon with a timescale of a year or longer. Sub-seasonal weather acts rapidly on the coupled ocean-atmospheresystem with a time scale of weeks to months. Eastward-propagatingconvective anomalyrelated to the MJO(Madden-Julian Oscillation)creates strong low-level winds.
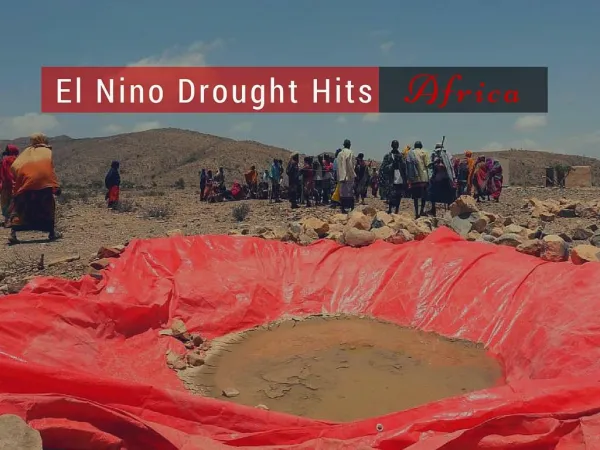
El Niño IMPACTS “Expectations” of climate anomaliesduring El Niño events Source: Ropelewski & Halpert, 1987 J. Climate http://www.cpc.ncep.noaa.gov/products/analysis_monitoring/impacts/warm.gif
Monsoon Rainfall Index Red = warm NINO3 SSTA - El Niño Blue = cold NINO3 SSTA - La Niña
“Relative Frequency”of Climate Impacts(rainfall) due toEl Niño Events Data & maps available through IRI Data Library: http://iridl.ldeo.columbia.edu/SOURCES/.IRI/.Analyses/.ENSO-RP
Drought & El Nino Spatial Extent of Tropical Drought Correlated with El Niño Note: 5 month lag between max. NINO3.4 SSTA and extent peaks Source: B. Lyon, 2004, GRL
What is the indirect (i.e. through climateteleconnections) impact of El Niño events on CO2 variability?
Summary • The basic ENSO mechanism is understood, and can be predicted, but gaps remain • Role of MJO/WWBs, different “flavors” of ENSO, decadal differences in predictability • Prediction skill is limited by Model flaws, data assimilation methods, limited data, inherent limits to predictability • ENSO events have global impacts Many occur reliably, but most are just more likely with an El Niño or La Niña event • ENSO events impact CO2 variability