Download
1 / 28
531 likes | 1.24k Views
IMPROVING WATER USE EFFICIENCY OF FIELD CROPS THROUGH REGULATED DEFICIT IRRIGATION. Fadi Karam Lebanese Agricultural Research Institute Department of Irrigation and Agro-Meteorology - Tal Amara ( http://www.lari.gov.lb ) Kamal Karaa Litani River Authority

E N D
IMPROVING WATER USE EFFICIENCY OF FIELD CROPS THROUGH REGULATED DEFICIT IRRIGATION Fadi Karam Lebanese Agricultural Research Institute Department of Irrigation and Agro-Meteorology - Tal Amara (http://www.lari.gov.lb) Kamal Karaa Litani River Authority Department of Rural Development – Beirut – Lebanon Nazir Tarabey Association of Irrigation Water Users in South Bekaa Scheme – Lala - Lebanon WASAMED – International Conference on “Water Saving in Mediterranean Agriculture & Future Research Needs”, IAMB, Bari, 14-17 February 2007
Efficiency Is the ratio OUTPUT INPUT • Irrigation efficiency (Ei) • Agronomic water use efficiency (WUEa) • Physiological water use efficiency (WUEp)
YIELD OR BIOMASS (kg m-2) WUEg,b (kg m-3)= EVAPOTRANSPIRATION (m3m-2) Agronomic water use efficiency (WUE) (1 kg m-3 = 1 g m-2 mm-1) Subscripts g and b indicate grain yield and biomass
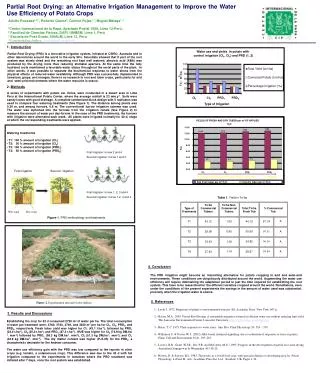
Water saving approach Develop new irrigation scheduling, not necessarily based on full crop water requirement, but one designed to ensure the optimal use of allocated water: Partial irrigation
Deficit Irrigation • DI or RDI is one way of maximizing water use efficiency (WUE) for higher yields per unit of irrigation water applied. • The crop is exposed to a certain level of water stress either during a particular growth period or throughout the whole growing season, without significant reduction in yields.
Objectives • Increase WUE of a crop by eliminating irrigations that have little impact on yield. • Yield reduction may be small compared with the benefits gained through diverting the saved water to irrigate other crops.
YIELD RESPONSE TO WATER • Yields increase with water availability in the root zone, until a saturation level, above which there is little effect. • Yield response curve of specific crops depends on weather conditions and soil type as well as agricultural inputs.
EXPERIMENTAL PLAN • Maize, a determinate species with a limited capacity to adjust grain yield in response to water availability (Karam et al, 2000; 2003); • Soybean, an indeterminate species with a high capacity to compensate the effects of early water stresses (Karam et al., 2005); • Cotton, an indeterminate species with a larger capacity to adjust the number of dehiscent bolls under stressful conditions (Karam et al., 2006); • Sunflower, a determinate species with a single inflorescence and an aptitude to tolerate moderate water stresses (Karam et al., 2007).
SOIL-WATER BALANCE Dynamic-oriented Process Where t2–t1 is the time interval over which measurements are made, zo is the soil surface and z is the depth to the lowest point of measurement and is the volumetric soil water content.
ACTUAL SOIL MOISTURE CONTENT t is actual moisture content of the root zone at time step t (cm3 cm-3) INup is rate of net influx through the upper root zone boundary (cm d-1) INup = P + Ie – Es + SSt/ t - SR INlow is rate of net influx through the lower root zone boundary (cm d-1) INlow = CR - Perc Ta is actual transpiration rate of crop (cm d-1) RD is actual rooting depth (cm); P is precipitation intensity (cm d-1) Ie is effective daily irrigation (cm d-1); Es is soil evaporation rate (cm d-1) SSt is surface storage (cm); SR is rate of surface runoff (cm d-1) CR is rate of capillary rise (cm d-1); Perc is percolation rate (cm d-1) t is time step (cm d-1); Zt is depth of groundwater table (cm).
SOIL WATER CONTENT A = Root Absorption Z = soil depth
DISADVANTAGES • The system requires highly qualified technicians for installation and maintenance and highly qualified personnel for running the system i.e. farmer by himself cannot use the system. • Very expensive system • System fragile and subject to vandalism. • Can be affected by climate adversity (flooding, heavy rain, etc) • Radio transmission can be affected by nature barrier or geographical relief • Problems of data discontinuity or delaying due to radio or other tele-communication interference
Soil moisture measurement • Method of measurement: TDR (Time Domain Reflectometry) • Frequency: before and after irrigation supplies, at 30 cm increment in the 0-120 cm of soil depths.
Weighing Lysimeter (ETcrop) ET measurements (Hourly and Daily) Location (middle of the Exp. field) Area (4 4 m²) Depth (1 m) Weight (22000 kg) Watered at 30% of SWD Linked to a weight indicator Weight loss recorded (4 times/hr; 94 readings/day)
Rye-grass drainage Lysimeters (ETrye-grass) ET measurements (3-to-4 day interval) Location (middle of the Exp. field) Area (2 2 m²) Depth (1 m) Watered at 30% of SWD ET = I – D ± Q (Q = 0 when irrigation is frequent)
First year ETref (Rye-grass drainage lysimeters) ETcrop (weighing or drainage lysimeters) Kc = ETcrop/ETref Second year ETref (Rye-grass drainage lysimeters) ETcrop = ETref x Kc METHODOLOGY
Climatic-Water Balance: FAO Penman-Montheith ETcrop = ETo × Kc
Soybean (2000-2001) (Karam et al., 2005; data points are means of five quadrates of 1m2 each per treatment)
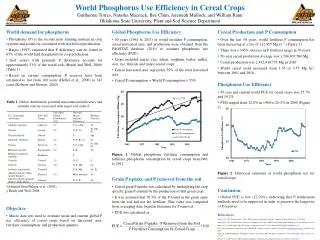
Results are a kind of database for the country • Corn seasonal ET reached on the lysimeter 952 mm in 1998 and 920 mm in 1999. Grain-related water use efficiency (WUEg) varied in corn treatments from 1.34 to 1.88 kg m-3, while at biomass-basis (WUEb) the values varied from 2.34 to 3.23 kg m-3. • Soybean seasonal ET totaled 800 mm in 2000 and 725 mm in 2001. Seed-related water use efficiency of soybean (WUEs) varied from 0.47 to 0.54 kg m-3, while WUEb varied from 1.06 to 1.16 kg m-3. • Cotton, seasonal ET was 641.5 mm in 2001 and 669.0 mm in 2002. Average WUEl values varied among treatments from 0.43 to 0.64 kg m-3, while WUEb varied from 1.82 to 2.16 kg m-3. • Sunflower, average across years of evapotranspiration attained 672 mm. WUEs of sunflower varied among treatments from 0.76 to 0.87 kg m-3, while at biomass-basis WUEb varied from 3.46 to 4.1 kg m-3.
Concluding remarks Improvement of water use efficiency requires information on water consumption by the crop Use of modern irrigation methods can result in less water losses More experiments are needed with respect to different agro-climatic zones.