Download
1 / 12
120 likes | 279 Views
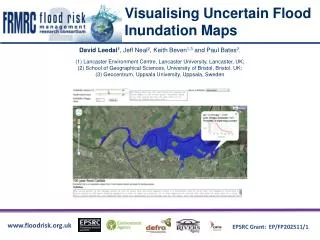
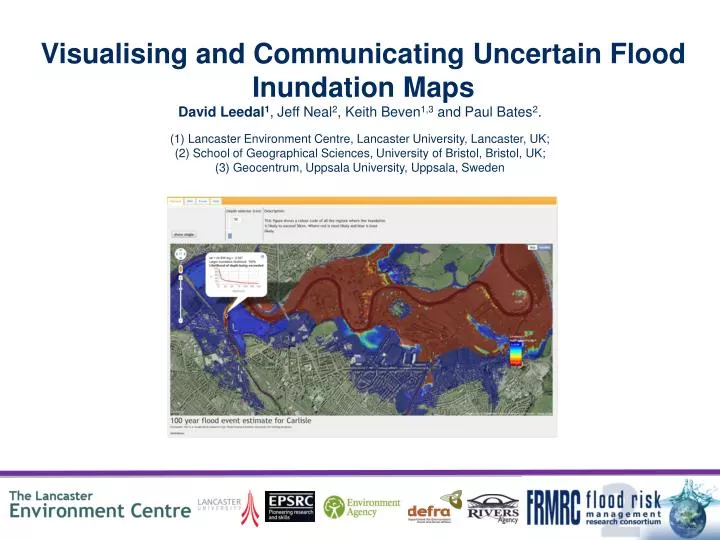
Visualising and Communicating Uncertain Flood Inundation Maps. David Leedal 1 , Jeff Neal 2 , Keith Beven 1,3 and Paul Bates 2 . Lancaster Environment Centre, Lancaster University, Lancaster, UK; School of Geographical Sciences, University of Bristol, Bristol, UK;

E N D
Visualising and Communicating Uncertain Flood Inundation Maps David Leedal1, Jeff Neal2, Keith Beven1,3 and Paul Bates2. Lancaster Environment Centre, Lancaster University, Lancaster, UK; School of Geographical Sciences, University of Bristol, Bristol, UK; Geocentrum, Uppsala University, Uppsala, Sweden
Guidelines for flood risk mapping • Guidelines and framework for best practice in uncertain flood risk mapping (FRMRC2 WP1.7) provides: • A comprehensive background in state-of-the-art thinking and methods for uncertainty analysis • A breakdown of the flood risk modelling procedure into 7 key processes • A series of decision trees for each process • A set of case studies showing examples of the guidelines in action
Types of uncertainty • The Guidelines and Framework emphasises methods for aleatory and epistemic uncertainty. • Aleatory: arising from the natural variability of the process • Epistemic: shortcoming in knowledge about the process
Addressing epistemic uncertainty • Objective is to elicit and record expert opinion in a reflexive way and to document the thoughts, decisions and processes of those involved. • The ‘Guidelines and Framework’ suggests the modelling process should be documented in sufficient detail to provide a record of the decisions and methods used during the modelling exercise
What are the benefits of documenting a modelling exercise? • Transparency – providing a record of which processes were carried out and why • Which model was used and why? • Which parameters were adjusted and within what range? Why? • What topography was used? • How where bridges treated? • How many MC realisation were performed? • etc…
What are the benefits of documenting a modelling exercise? • Improve work practice – standardisation etc • Method of communication with others • Transfer skills and experience • Receive support (and criticism)
These methods address epistemic uncertainty by: • Explicitly communicating the degree to which a factor is understood • Describing how a factor was addressed • Making the process open so that others can: • appreciate the degree of understanding • contribute to better understanding if possible • Over time produce a catalogue of cases that can be studied
These methods address aleatory uncertainty: • Monte Carlo • Event generators • GLUE • Bayesian methods • …many more (applied separately and in combination)
Carlisle uncertain flood inundation study • Carried out by Jeff Neal (Bristol) and Caroline Keef (JBA) • Boundary condition upstream input event generator produced 47000 multivariate input scenarios (with model identified from observed level + rating curve record) • LISFLOOD-FP 2D hydrodynamic model simulated flood spreading over 5m grid for each scenario (using HPC) • 40GB data generated • Frequency of depth exceedence for each model cell can be calculated from data set
Data visualisation • The ‘Guidelines and Framework’ outlines the need for a modelling study to provide a clear method to visualise the complex data sets produced by uncertainty analysis. This method should: • Allow non-experts to gain an insight into the identified uncertainty in the study • Provide a means to support decision making if necessary
The Google maps uncertain flood inundation visualisation tool • Things to look out for: • Data stored centrally • Familiar Google maps background and UI • User friendly UI widgets • Visual and text-based communication • Wiki and bulletin board • The web-tool can be accessed from: • http://www.lancs.ac.uk/postgrad/leedald/Carlisle/visualisation.html • This address may change for future versions so please contact d.t.leedal@lancaster.ac.uk to make sure you have the most up to date URL