
Introduction
Spatial Variability Of Soil Properties and Citrus Tree Performance. Qamar-uz-Zaman, Post-Doctoral Research Associate and Arnold W Schumann, Assistant Professor, Dept. Soil and Water Science University of Florida – IFAS, Citrus Research and Education Center, Lake Alfred, FL33850. Results.

Introduction
E N D
Presentation Transcript
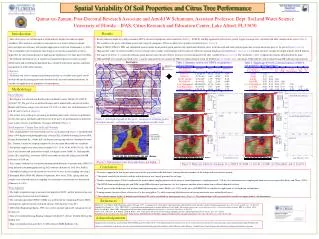
Spatial Variability Of Soil Properties and Citrus Tree Performance Qamar-uz-Zaman, Post-Doctoral Research Associate and Arnold W Schumann, Assistant Professor, Dept. Soil and Water Science University of Florida – IFAS, Citrus Research and Education Center, Lake Alfred, FL33850 Results Introduction • Most citrus groves are still managed as uniform blocks despite their inherent spatial variability. The variation in soil and tree characteristics may lead to reduced yield and decreased input use efficiency with uniform application at field scale (Schumann et al. 2003). • To accommodate such variation one may design a site-specific management system as opposed to the conventional practice of applying one uniform rate over large groves or blocks. • Development and ultimate use of variable rate management practices requires accurate identification and assembling of appropriate data, reliable interpretation, analysis and proper management of within-field variation. Objective • To identify soil factors causing tree performance decline in a variable citrus grove, and to develop soil-specific management zones based on easily measured soil/tree parameters for variable rate applications of appropriate soil amendments. • Results indicated moderate to high variation in NDVI, selected soil properties and leaf nutrients (Table 1). SOM, Fe, and Mg significantly affected tree growth. Copper was negatively correlated with other variables in the grove (Table 2). • The variables in the grove with similar spatial scale (range of variograms, 250 m) are likely to be spatially correlated [Figures 2 (a)-(f )]. • Maps of NDVI, SOM, Fe, NIR, and chlorophyll showed similar broad gradual spatial patterns with significantly different values in the the north and south central regionsthan western and eastern parts of the grove [Figures 2 (a)-(f )]. • High and low values of selected variables were in two large zones, roughly corresponding to the locations of Zolfo fine sand and Jonathan soil series [Figures 1 & 2 (a)-(e )]. Jonathan soils have strongly developed, infertile, deep E horizons. • The map of Cu [Figure 2 (f)] also showed large spatial patterns across the grove but the trend was reversed compared to the other variables [Figures 2 (a)-(e )]. The correlations (Table 2) support the relations identified from the maps. • NIR and SOM were strongly correlated (Table 2) and the spatial patterns of variation for NIR were almost identical to that for SOM [Figures 2 (b)and 2 (d )]. This means SOM could be easily estimated using NIR reflectance spectrometry. Methodology • Grove History • Revell grove was selected near Bowling Green in Hardee county, Florida (27.63089oN, 81.82467o W). The grove has no artificial drainage and is planted with a mixture of mature Hamlin and Valencia oranges at an elevation 33.5 to 38.1 m above msl, with dimensions of 789 m E -W, and 712 m N-S (Figure 1). • The weaker areas of the grove are mainly on Jonathan sand (sandy, siliceous, hyperthermic, ortstein Grossarenic Alorthods) and better areas of the grove are predominantly on Zolfo fine sand (sandy, siliceous, hyperthermic, Oxyaquic Alorthods) (Figure 1). • Soil Properties, Canopy Size and Leaf Nutrients • Fifty sampling points were located in the grove as an irregular grid (Figure 1) and positioned from a 1999 digital aerial photograph using a Garmin XL12 Global Positioning System (GPS; Garmin International Inc., Olathe, KS) and Fugawi moving map software (Northport Systems Inc., Toronto, Canada) on a laptop computer to cover the major observable tree variability. • Soil profile samples were taken from six depths (0-15, 15-30, 30-60, 60-90, 90-120, 120-150 cm) at each location and analyzed for soil pH, soil organic matter (SOM, %), Exchangeable acidity (EA, meq/100g), soil texture, DTPA-extractable soil iron (Fe, mg/kg) and soil NIR reflectance at 1194 nm. • Tree canopy condition was estimated from normalized difference vegetation index (NDVI %) using infrared-color photography and Ag 20/20 software (Institute for Tech. Dev. NASA). • Chlorophyll readings were taken from five leaves of six trees at each sampling site using a Chlorophyll Meter SPAD-502 (Minolta Corporation, New Jersey, USA). Spring-flush leaf samples were collected from each sampling site and nutrient concentration was determined (Obreza et al. 1992). • Data Analysis • The depth-weighted average of measured soil properties, NDVI, and leaf nutrients data were analyzed using classical statistical techniques. • The correlation procedure (PROC CORR) was used to find the relationship between NDVI, soil properties and leaf nutrients with SAS software (SAS Institute, Cary, NC). • GEO_EAS (Englund and Sparks, 1991) was used to calculate and model variograms for all the data sets. • Data were interpolated using Kriging technique with Surfer 7 software (Golden Software Inc., Golden, CO). • Maps were produced using ArcView 3.2 GIS software (ESRI, Redlands, CA). NDVI Soil NIR Absorbance Variance Variance (d) (a) SOM Lead Chlorophyll Index Figure 1: Aerial photograph of the grove, locations of sampling points, elevation contours, soil series and survey boundaries for this study Variance Variance (e) (b) Soil Fe Leaf Cu Variance Variance (f) (c) Lag Distance (m) Lag Distance (m) Figure 3: Management zones (Low, medium and high ) Figure 2: Maps and spherical variograms of (a) NDVI, (b) SOM, (c) Soil Fe, (d) NIR, (e) Chlorophyll, and (f) Leaf Cu Conclusion • Excessive copper in the low organic matter areas of the grove induced Fe deficiency, causing chlorotic disorders of the foliage and restricted tree growth. • The spatial variability in selected variables within the grove was largely governed by soil type. • Similar variogram ranges (250 m), emphasize the need to adjust sampling intensity to the range of spatial dependence (sampling interval ~100 m), to avoid unnecessary sampling and analytical cost as reported by Kerry and Oliver, (2003) . • The NDVI (from aerial photograph) and SOM (using NIR reflectance spectrometry) are less expensive ancillary data to obtain than yield and chemical soil data. • Revell grove can be divided into low, medium and high management zones (Mulla et al. 1991) on the basis of SOM/NDVIfor variable rate application of chelated iron and dolomite. • Liming controls the toxic effects of excessive Cu, by raising pH to 7.0, while correcting Mg deficiencies in low organic matter areas within Revell grove. • The required amount (kg/ha) of dolomite and elemental Fe can be calculated for management zones (Figure 3). Prescription maps will be generated for variable rate application of soil amendments. References Mulla, D.J., A.U. Bhatti, M.W.Hammond, and J.A. Boason. 1992. A comparison of winter wheat yield and quality under uniform versus spatially variable fertilizer management. Agri. Ecosystem. and Environ. 38: 301-311. Englund, E. & Sparks, A. 1991. GEO-EAS 1.2.1 geostatistical environmental assessment Software-Users Guide. Environment monitoring system laboratory office of research and development. EPA., Las Vegas. USA. Kerry, R. and M.A. Oliver. 2003. Variograms of ancillary data to aid sampling for soil surveys. J. Precision Agriculture. 4. 261-278. Obreza, T.A., A.K. Alva, E.A. Hanlon, and R.E. Rouse. 1992. Citrus grove leaf tissue and soil testing: Sampling, analysis, and interpretation. Fla Co-op Ext. Serv. Circ. SL115. Schumann, A.W., A. Fares, A.K. Alva, and S. Paramasivam. 2003. Response of ‘Hamlin’ orange to fertilizer source, rate and irrigated area. Proc. Fla. State Hort. Soc. 116: (21) 372-381. Acknowledgements Support for this research was received from USDA-IFAFS grant No. 2001-52103-11323 Maintaining the Competitiveness of Tree Fruit Production Through Precision Agriculture and a donation from Cargill Fertilizer. The authors would also like to thank the assistance and contribution from Tom Pospichal, Kevin Hostler, Adair Wheaton, Jodie Whitney, Gerald Perkins, Stuart Pocknee and John Roegner during the field data collection.


