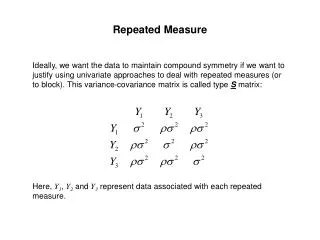
Enhancing Repeated Surveys: Design, Accuracy, and Data Processing**
This presentation focuses on the critical aspects of repeated surveys, highlighting their significance in statistical analysis and policy-making. Key areas covered include definitions and concepts, challenges related to sampling and estimation, and the importance of accuracy. Additionally, we explore data collection techniques, time series issues, and evaluation methods. By understanding how to leverage data from repeated surveys effectively, statistical offices can improve their methodologies, ensure better accuracy, and adapt to changing data over time for enhanced insights.


Enhancing Repeated Surveys: Design, Accuracy, and Data Processing**
E N D
Presentation Transcript
Presented by • Eva Elvers • Statistics Sweden
Outline • Definition and related concepts • Why treat in a separate module? • Some typical issues • Frames, sampling, and estimation • Data collection and data processing • Time series issues • Tests, experiments, and evaluation • Design issues
A repeated survey • A repeated survey is • carried out more than once • mostly/often with a regular frequency. • Most surveys in a statistical office are repeated, e.g. STS and SBS.
A few related concepts • Some concepts and terms: • Longitudinal survey; longitudinal data • Panel survey; panel, rotation panel • Survey with overlap over time • Coordinated samples; independent samples • Why such data and surveys/studies? • Study on unit level • Accuracy reasons
Why a separate Memobust module? • Discuss possible reasons to consider and describe Repeated surveys separately
Why enhance in a separate module Some major reasons: • Possibilities to make improvements over time. • Possibilities to utilise previous data if a unit is included repeatedly. • Issues related to time series breaks. • ?
Note • Many issues are mentioned here. • For most of them there will be more information in other topics and parts of the course (later today or tomorrow). • Some issues are considered here only.
Accuracy (and response burden) Normally • Measures of change are important. • Higher accuracy requested for estimators of change than for estimators of level. • Accuracy, in general: • considerable overlap between samples over time • include and handle population changes: births, deaths, splits, change of industry, …
(Accuracy and) response burden • Few surveys and few times! • Not jump in and out of a survey. • Be selected for a survey during a period and then not at all for a period.
Frames and sampling • Sample design with overlap • Participation over a time period for each business (statistical unit: enterprise, …) • Frame construction: up-to-date information, as far as possible • Draw the sample • Reality is a bit different due to deaths, splits, …
Some issues for frames & sampling • How often do you construct a new frame and draw a new sample? • Advantages of frequent updates? • Disadvantages of frequent updates? • Do you feed back information about changes to the Business Register? • Do you update the frame? When? • Are there risks/disadvantages of updates?
Sampling and estimation (1) • Sample, consider e.g. industry and size • Changes are due to • Population changes (births, deaths, …) • Variable values change • Estimation methods • Changes, organisational • Coverage • Auxiliary information, calibration
Sampling and estimation (2) • Point estimation • Interval estimation, e.g. confidence intervals • Outliers • True value • Highly influential • Bias and variance • Learn
Data collection & processing (1) • Providing previous values • Assistance to respondent. • May discover previous error. • Previous error may remain.
Data collection & processing (2) • Corrections of previous micro-data • Possibly effects on macro-data • Size? • Correction of statistics needed? • Revisions are planned
Data collection & processing (3) • Using previous values in imputation • Model • Similarity? • Group average for level • Own value and group change
Time series issues (1) • Comparability over time • Definitions • Methodology • Reality and user needs change
Time series issues (2) • Reasons for breaks, e.g. • New definitions due to new needs • Align with other statistics • Better methodology
Time series issues (3) • Methods to overcome breaks • Double period • Planned, study • Model, e.g. when NA change a source
Time series issues (4) • Revision of a classification, e.g. a new version of NACE • Two major approaches • Micro • Macro • Time series, back-casting • Assumption about relationships
Tests and experiments • Pilot study • qualitative; • quantitative. • Tests and experiments • Embedded experiment • Would … mean an improvement? E.g. contact strategy • Can … be changed without effects on the estimates?E.g. data collection mode
Evaluation • For this repeated survey and possibly others • Teamwork to summarise and suggest actions for future rounds • Quality indicators, e.g. • Accuracy planned and achieved. • Response rates, over time, on item level etc. • Signals in editing and debriefing with staff • Revision sizes
Design issues • New repeated survey(groups 1, 4) • Frame, sampling, estimation(groups 2, 5) • Improvements of repeated surveys(groups 3, 6)
Conclusions • Many surveys are repeated • Design from the beginning, as repeated • Utilise the advantages, with data, … • Evaluate and feed back • Improve in a controlled way; consider time series, effects