Download
1 / 14
240 likes | 735 Views
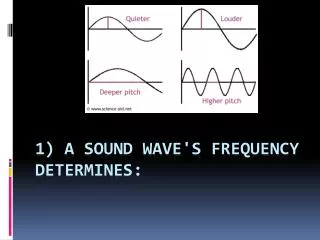
FREQUENCY SPECTRUM OF A SOUND. A sound which consists of a single frequency is called a pure tone. Sound with various frequencies. Noise produced by most mechanical sources, such as machines, is made up of many different unrelated frequencies (wide band noise), and tends to sound unpleasant.

E N D
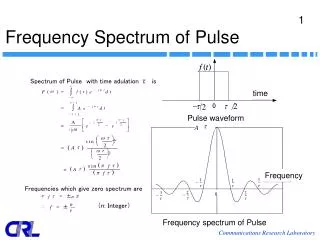
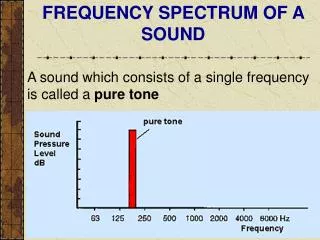
FREQUENCY SPECTRUM OF A SOUND A sound which consists of a single frequency is called a pure tone
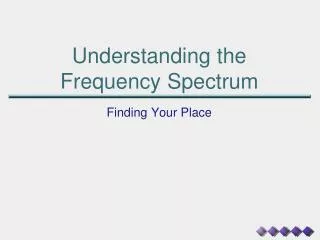
Sound with various frequencies Noise produced by most mechanical sources, such as machines, is made up of many different unrelated frequencies (wide band noise), and tends to sound unpleasant. The graph of the magnitude of the sound pressure level at each frequency is called the frequency spectrum of the sound.
FREQUENCY ANALYSIS It is often necessary to obtain information about the frequency spectrum of a sound to design effective noise control and to select appropriate personal hearing protectors
31.5 Hz 63 Hz 125 Hz 250 Hz 500 Hz 1k Hz 2k Hz 4k Hz 8k Hz 16k Hz • OCTAVE BANDS • In most cases it is sufficient to measure the sound pressure level in bands of frequencies, rather than at individual frequencies. • The width of the band usually chosen is the octave band - this is a band where the upper frequency is twice that of the lower. • Each band is denoted by its centre frequency. Those usually measured are the Internationally Preferred Frequencies of:
This is a typical spectrum of a circular saw cutting aluminium
Centre frequency, Hz Limits of band, Hz The limits of the octave bands are shown in the Table below 31.5 22 - 45 63 45 - 89 125 89 - 177 250 177 - 353 500 353 - 707 1000 707 - 1414 2000 1414 - 2828 4000 2828 - 5657 8000 5657 - 11314 16000 11314 - 22627 Note that the centre frequency is the geometric mean and not the average of the band limit frequencies.
f lower= = The lower and upper frequencies in the band can be found from the centre frequency by: f upper=fcentrex 2 =1.414
ONE-THIRD OCTAVE BANDS Sometimes we want more detailed information than the octave band analysis will give. This can be provided by selecting narrower bands, such as one-third octave bands. One-third octave band centre frequencies in the audible range are: 25, 31.5, 40, 50, 63, 80, 100, 125, 160, 200, 250, 315, 400, 500, 630, 800, 1k, 1.25k, 1.6k, 2k, 2.5k, 3.15k, 4k, 5k, 6.3k, 8k, 10k, 12.5k, 16k, 20k Hz.
The lower and upper frequencies of the one-third octave bands are given by: flower = fupper = fcentre x 21/6 = 1.122 x fcentre
NARROW BAND ANALYSIS For even more detailed examination, narrow band analysis is possible. This is used to pick up tonal noises with very narrow frequency bandwidths which would be missed by octave or one-third octave band analysis.
FREQUENCY WEIGHTING NETWORKS • A AND C WEIGHTING NETWORKS • Since the ear does not have an equal response to sounds of different frequencies we need to take this into account when we measure sound in relation to its effect on people.
Octave Band Centre Frequencies, Hz 31.5 63 125 250 500 1000 2000 4000 8000 16000 ADJUSTMENTS AT OCTAVE BAND CENTRE FREQUENCIES From the weighting curves above, you can see that the following are the adjustments at octave band centre frequencies: A-weighting adjustment, dB -39 -26 -16 -9 -3 0 +1 +1 -1 -7 C-weighting adjustment, dB -3 -1 0 0 0 0 0 -1 -3 -8
Octave Band Centre Frequencies, Hz 31.5 63 125 250 500 1000 2000 4000 8000 16000 Example: What is the A-weighted sound pressure level in the cab of a diesel locomotive where the following octave band sound pressure levels were measured? Diesel locomotive octave band levels, dB 104 102 92 90 87 82 80 68 60 57 A-weighting adjustment -39 -26 -16 -9 -3 0 +1 +1 -1 -7 A-weighted octave band levels, dB(A) 65 76 76 81 84 82 81 69 59 50