Download
1 / 53
550 likes | 744 Views
the Dynamic Land Ecosystem Model (DLEM) and Its Applications in north America. Ming-Liang Liu ( mingliang.liu@wsu.edu ) Department of Civil and Environmental Engineering, WSU, Pullman, WA Prior Institute: International Center for Climate and Global Change Research

E N D
the Dynamic Land Ecosystem Model (DLEM) and Its Applications in north America Ming-Liang Liu (mingliang.liu@wsu.edu) Department of Civil and Environmental Engineering, WSU, Pullman, WA Prior Institute: International Center for Climate and Global Change Research Ecosystem Dynamics and Global Ecology Laboratory Auburn University, Auburn, AL October 14, 2011
Acknowledgements • Hanqin TIAN • Chi ZHANG • Guangsheng CHEN • Chaoquan LU • Wei REN • Xiaofeng XU • Jia YANG • Supported by NASA IDS, NASA LCLUC, DOE NICCR
Outline • Model Introduction – Dynamic Land Ecosystem Model (DLEM) • Recent Improvements • Validations • Applications • Discussions
Introduction • Regional Earth System Model http://www.pnnl.gov/atmospheric/iresm/modeling.stm
Model (DLEM) Chen et al., 2006; Liu et al., 2008; Ren et al., 2007a; Ren et al., 2007b; Ren et al., 2011b; Tian et al., 2011; Tian et al., 2010a; Tian et al., 2010b; Tian et al., 2010c; Xu et al., 2010; Zhang et al., 2007
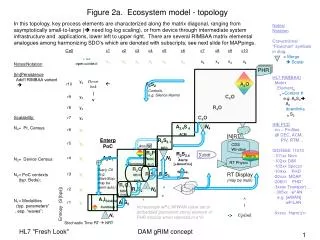
INPUT MODEL OUTPUT Climate .Temperature .Precipitation .Radiation .Relative Humidity Atmospheric Compositions .CO2 .O3 .Nitrogen Deposition Land Use .Deforestation .Urbanization .Harvest .Fertilization .Irrigation Other Disturbances .Wildfire .Disease .Climate Extremes CO2 Related: .Carbon Storage .Harvest .Ecosystem Respiration .Net Primary Productivity .Net Ecosystem Exchange .Export of DOC and POC Driving Factors Non-CO2 GHG; .CH4 Emissions .N2O Emissions Dynamic Land Ecosystem Model Water Related; .Surface Runoff .Subsurface Flow .Evapotranspiration .Soil Moisture .River Discharge Soil .Physical Properties .Chemical Properties .Depth Geomorphology .Elevation .Slope .Aspect River Network .Flow Direction .Accumulative Area .River Slope .River Length .River Width Vegetation Functional Type Cropping System Controlling Factors Nitrogen Related: .Nitrogen Storage .Mineralization Rate .Nitrofication Rate .Denitrification Rate .Export of TN
Improvements • From single land cover to cohort structure • Rainfall disaggregation • Multi-soil layer, TOPMOD, Ground water - CLM methods • River routine
From single land cover to cohort structure vegetation cover, impervious surface, lake, stream, sea, bare ground, and glacier
Rainfall disaggregation Sivakumar & Sharma, 2008 Connolly et al., 1998
Multi-soil layer, TOPMOD, Ground water - CLM methods Liu et al., 2008 Niu et al., 2007, 2009 Beven & Kirkby, 1979
Precipitation Rain Snow Sublimation Canopy Evaporation Water-surface Evaporation Evaporation Liquid Snow Interception Impervious surface Water body (lake, stream) Surface Runoff Canopy (1, 2, …n types) Discharge Transpiration Sublimation Throughfall Soil Evaporation Water Uptake Surface Runoff Melt Snow cover Infiltration Saturated area Zone of aeration Redistribution Recharge Water Table Zone of saturation Soil Recharge Aquifer Drainage Runoff Hydrological processes simulated by DLEM
Validations • Field observations, e.g. AmeriFlux network • River gauges • Model-data fusion data sets, e.g. up-scaled observations • Other regional model results
Model Validations Distributions of AmeriFlux towers for model validation
Validations Comparison of simulated discharges with reconstructed historical discharge and USGS observations (MARB) The comparison of simulated ET vs observations
Rosemount G19 Alternative Rotations (cropland) Missouri Ozark (Deciduous Broad-leaf Forest)
Connecticut Hudson Delaware
Susquehanna Potmac James
Verification of C&N export DIN export from Mississippi river basin
Applications • The Gulf of Mexico • The Eastern Coast
Data • DEM, slope: HRDRO1K data sets • Lake, river fractional data: SRTM-Water Body Data; GLC2000; Global Lakes and Wetlands Database (GLWD) • Soil data: ISRIC-WISE derived soil properties with 5×5 arc-minute resolution • Climate: North America Regional Reanalysis (NARR) data from NCEP • River networks: 5 arc-minute global river networks (Graham et al., WRR, 1999)
Study area and land cover in 2005 (land cover shows the dominant type in each 5 arc-minute grid) Sub-basins: EC: East Coast of GOM; MARB: Mississippi-Atchafalaya River Basin; TB: Texas Basin; RGB: Rio Grande Basin; WSC: Western and Southern Coast of GOM
Land use conversions during 1901-2005 (The different color shows the dominant conversion in each 5 arc-minute grid and total change is larger than 5% of grid area)
Anomalies of ET, runoff, and precipitations during 1901-2008 (unit: mm per year)
Eastern coast Eastern Coast Study Area
Land-use/land-cover Land use, 2005 Land use conversions, 1901-2005
Climate change % per Century of precipitation °C per Century Trend in annual temperature and precipitation, 1901-2008
Spatial pattern of runoff Mean annual runoff, 1901-2008 (mm/year) Trend in annual runoff, 1901-2008 (% per Century)
TOC yield and trend Mean TOC yield, 1901-2008 (gC/m2/year) Trend in TOC yield, 1901-2008 (gC/m2/year/year)
Total nitrogen yield and trend Mean TN yield, 1901-2008 (gN/m2/year) Trend in TN yield, 1901-2008 (gN/m2/year/year)
Driving forces - on TN export Estimated anomaly of TN export under different simulation experiments
Other applications • NACP – Site and regional model-data comparison • North America GHG emissions • Southeast of US • China GHG budget • Monsoon Asia • Global
The annual mean leaching and exports of nutrients from land surface of North America during 1961-1990 as estimated by Dynamic Land Ecosystem Model with Nutrients Export (DLEM-NE) A. TN leaching from inland watershed (gN/m2/year) B. TN export from each 0.5° ×0.5° grid to downstream grid (Metric ton N/grid) C. TOC leaching from inland watershed (gC/m2/year) D. TOC export from each 0.5° ×0.5° grid to downstream grid (Metric ton C/grid)
NEE Seasonal cycle (Howland) Image credit: Dan Ricciuto Preliminary results of model-data Inter-comparison for the NACP Site-Level Interim Synthesis • Peter Thornton, Kevin Schaefer • NACP Synthesis Management Team • Ameriflux and Fluxnet Canada Investigators • Modeling Team Investigators • Dan Riccuito, Barbara Jackson
Inverse Models Forward Models Net Ecosystem Exchange Temperate North America Regional Interim SynthesisBreakout Discussion ReportNACP Interim Synthesis WorkshopOak Ridge, TN, November 9-11, 2009 • By W. Mac Post