Download
1 / 23
230 likes | 263 Views
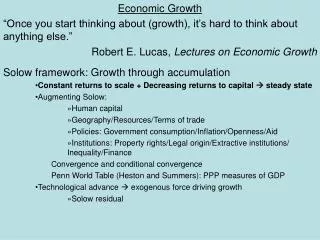
Chapter 3 – second lecture. Introducing Advanced Macroeconomics: Growth and business cycles. CAPITAL ACCUMULATION AND GROWTH: THE BASIC SOLOW MODEL. The basic Solow model (repetition). Parameters: and . constant: we focus on capital accumulation

E N D
Chapter 3 – second lecture Introducing Advanced Macroeconomics: Growth and business cycles CAPITAL ACCUMULATION AND GROWTH: THE BASIC SOLOW MODEL
The basic Solow model (repetition) • Parameters: and . constant: we focus on capital accumulation • Given and the model determines and
Government sector • follows from the identity/definition and the national accounting identity • Same construction with a public sector: • Insert into the identity to get
We can use the model as it stands. We just have to reinterpret as the sum of private and government capital stock and as the sum of private and public savings. Similarly the equation should be reinterpreted as: • The essential assumption underlying the Solow model interpreted to include a government is thus that thesum of private and public consumption as a fraction of GDP is a constant, . • This seems plausible empirically. And seems plausible for many Western countries:
The basic Solow model, short version • In previous lecture we saw that the Solow model leads to the transition equation: • and to the Solow equation: savings per capita Replacement investment to compensate for depreciation and growth of labour force ”technical term” appearing because of discrete time
The Solow diagram (repetition) Why does growth in and have to stop? Diminishing returns!
Comparative analysis in the Solow diagram • The economy is initially in steady state with parameters and . What happens if the savings rate increases permanently from to a new and higher level, ?
The economy is initially in steady state. No parameters change, but an exogenous event, e.g., a war or natural disaster, reduces the capital stock to half size ”over night”. How is this analysed in the Solow diagram?
Steady state • Last time we saw that the Solow model implies convergence to a unique steady state. From the Solow equationone easily computesand then
Some main lessons (repeated from previous lecture) • The elasticity of wrt. is :an increase in the savings rate of 10%, e.g. from 20 to 22%, gives a long run increase in income per worker of around 5% according to the basic Solow model! • The elasticity of wrt. is ! Note that the effect is stronger than one-to-one due to capital accumulation. • Another steady state prediction concerns the real interest rate…
The ”natural” interest rate • The real rate of interest is determined by productivity and thrift in the long run (Knut Wicksell): • Higher capital is more productive demand of capital per worker increases (ceteris paribus) higher equilibrium interest rate (the price of capital). • Higher supply of capital per worker increases the equilibrium interest rate decreases. • Reasonable parameter values on an annual basis, , implyand . This value for is very close to empirical observations of the real interest rate!
Structural policy • Crowding out: • Consider a permanent fall in caused by a permanent increase in government consumption as a percentage of GDP. • What happens on impact? is unaffected and still grows at the rate of , and is unaffected. But savings decrease and consumption increases. There is full crowding out. • What happens in the longer run? During a transitional period grows more slowly than at the rate of and falls down to a new lower steady state level. There is more than full crowding out. And the real interest rate increases. • The government cannot increase GDP by raising government expenditure in the long run. How about the short run? (Book Two)
Motives for tax-financed public services from a long run perspective • Public investments (that would not be made by private agents) For government consumption: • Public (non-rival and possibly non-excludable) goods • Public consumption, e.g., on education and health care, replacing private consumption, which means that is not affected • Distributive reasons • Externalities (education) • General productivity effects of public consumption, e.g., judicial system, health care etc.
Incentive policies: • Policies that do not affect model parameters directly through government expenditure/revenue, but indirectly through the way they affect private behaviour. We cannot analyze incentive policies explicitly because private behaviour has not been derived from optimization. • Golden rule:The that maximizes , which is , is called the golden rule savings rate. • The model suggests structural policies that • promote technology • encourage savings (assuming that is considerably below ): institutions and incentive • reduce
Growth in the basic Solow model • The long run prediction of the Solow model is its steady state. What is the growth rate of GDP per capita in steady state? • Zero! Not in accordance with stylized facts. • What is the growth rate of in steady state? Since and is constant, and must grow at the same rate, . GDP grows, but only at the same rate as the labour force. Why is that? • Assume that the economy initially is below steady state implying that . Then , implying that capital per worker increases. But, once again, because of diminishing returns the growth in and will ultimately cease. • However, there is transitory growth. How long-lasting is that?
Simulation • Initially we are in steady state with the following parameter values: representing a developing country. This implies that . • With effect first time in period 1, the savings rate increases permanently to corresponding to the savings rate of a typical Western economy, implying and . • Starting with in period zero and one we now simulateover . We also calculate , and etc. for and draw the evolutions of these variables in the following figures.
The evolution of , and after the increase in . (continued) The figures show that transitory growth is relatively long-lasting.
In the Solow model, the transition towards steady state is at least as important as the steady state itself. And during this transition there is growth in and . Hence, the basic Solow model is a growth model! • It is easy to find the growth rate of :This is called the modified Solow equation. • The growth rate of follows from .
Growth in GDP per worker is higher the further below steady state the economy is. This is in accordance with conditional convergence. • A permanent increase in gives a jump upwards in the growth rate of GDP per worker.
Conclusions based on the basic Solow model • What can a (poor) country do to create a transitory growth in GDP per worker resulting in a permanently higher level of income and consumption per worker? The basic Solow model provides the following answers: • Increase the savings rate • Reduce the growth rate of the labour force • Reduce the rate of depreciation, i.e. invest better • Improve the level of technology • How useful are these recommendations?