Download
1 / 17
170 likes | 331 Views
Why Go to College?. Continued…. Move to the micro…. Pygmalion in the Classroom (Rosenthal and Jacobson, 1968) All Hispanic Elementary School in San Francisco Harvard Test of Inflected Acquisition Told teachers could predict which students would bloom Came back 1 year later. Experiments.

E N D
Why Go to College? Continued…
Move to the micro… • Pygmalion in the Classroom (Rosenthal and Jacobson, 1968) • All Hispanic Elementary School in San Francisco • Harvard Test of Inflected Acquisition • Told teachers could predict which students would bloom • Came back 1 year later
Experiments • “Gold Standard” for testing hypotheses • Allows researcher to distinguish the effects of selection and influence • Two critical characteristics: • Experimenter manipulates the independent variable • Experimenter randomly assignssubjects to experimental condition
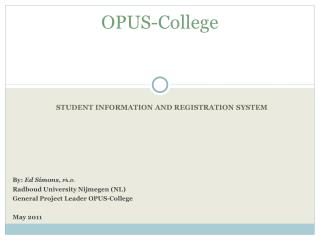
Percentages of First and Second Graders gaining 10,. 20, or 30 total IQ points CONTROLEXPERIMENTAL 10 Points 49% 79% 20 Points 19% 47% 30 points 5% 21% Rosenthal and Jacobsen, p. 76
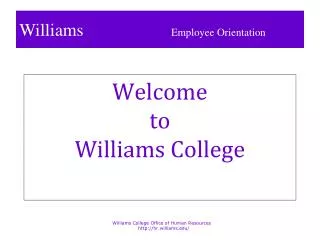
Classroom Behavior after one year: control and experimental groups CONTROLEXPERIMENTCHANGE Curious 5.506.25 (+.75) Interesting 5.466.43 (+.97) Future Success 5.536.48 (+.95) Adjusted 5.676.04 (+.37) Appealing 5.786.23 (+.45) Happy 5.776.33 (+.56) Affectionate 5.726.01 (+.30) Hostile 3.843.97 (+.13) Needs Approval 5.354.97 (-.38)
Conclusions • Teacher expectations matter • IQ and performance are plastic • Especially among younger students • Evidence of self-fulfilling prophecy • Ethical issues associated with doing study
Still, want to know how it happened • Ray Rist study • All Black elementary school in Harlem • Observed classrooms over a two year period • Watched how teachers interacted with students
Focus on seating and attention Teacher Table 1 Table 2 Table 3
How were students assigned to tables? • Teacher had image of successful student, which was related to social class background • Led to subjective evaluation whether or not students had desired traits, based on: • Physical appearance and odor of students • Interactional behavior • Language usage • Social and demographic information
Once assigned, what happened? • Tables received differential attention, rewards, teaching time • Students treated each other differently, and developed expectations for themselves and each other (looking-glass self) • A gap in achievement emerged • This gap became ‘objectified’ on standardized tests, which were used to place students the following year
Key finding of Rist’s Study Teacher’s view of success Child’s test scores Teacher Expectations For child Kid’s Class background
Classrooms and inequality • Studies of the classroom suggest that education may not be doing much to reduce inequality between generations • Rather, may be reproducing the class position of the parents • Tracking and teacher expectations are the mechanisms by which inequality is reproduced
What matters in education? • Opportunity* • Ability* • Performance* • Sanctions* • Understanding* • Ambition *socially constructed