Download

1 / 25
250 likes | 470 Views
Adequate Yearly Progress Grades 3-8 (AYP 101). Doug Strader Maryland State Department of Education. Overview. Adequate Yearly Progress(AYP) Must achieve all of the school’s targets for three indicators Reading Mathematics Attendance Annual Measurable Objectives(AMOs)

E N D
Adequate Yearly Progress Grades 3-8(AYP 101) Doug Strader Maryland State Department of Education
Overview • Adequate Yearly Progress(AYP) • Must achieve all of the school’s targets for three indicators • Reading • Mathematics • Attendance • Annual Measurable Objectives(AMOs) • There are a total of 23 different targets for a school
23 targets… • Attendance • All students • 11 Subgroups for Reading and Mathematics • All Students • Special Education Students • Limited English Proficient Students • Students Receiving Free and Reduced-Priced Meals • Hispanic/Latino Students • American Indian/Alaskan Native Students • Asian Students • Black or African American Students • Native Hawaiian or Other Pacific Islander • White Students(Not of Hispanic Origin) • Multiple Race Students
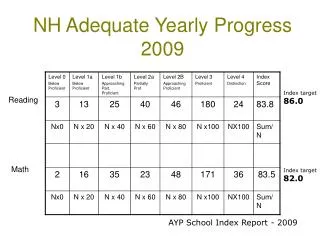
Attendance • Meet the AMO at the ALL student level (AMO is determined by the average of the grade levels within the school) • Grades 3-5 94% • Grade 6 - 93.86% • Grade 7 – 93.73% • Grade 8 – 93.62% • Safe Harbor – Uptick rule vs. Growth Target? • 2012 – measured at the subgroup level…
Performance indicators - Assessments • MSA • MOD-MSA • ALT-MSA • Grades 3 through 8 • Math • Reading
AYP Student Inclusion – (School level) • Must be enrolled as of September 30 to be included at the school level (Full Academic Year). • Two exceptions that still count as Full Academic Year… • 06—Re-entry after involuntary withdrawal termination, by the school or local administration, from school during the current August/September-June reporting period. • 08—Re-entry after involuntary withdrawal, by the school or local administration, from school during any reporting period prior to the current August/September—June reporting period.
Special Education Students • Exited SPED Students • Exited SPED students’ scores on MSA Reading and Math assessments must be included in AYP calculation for the SPED subgroup for two years following their exit from active SPED services. • Exited SPED students’ MSA scores count towards AYP proficiency, not AYP participation. • Students that have exited special education and immediately start a 504 plan, count towards the SPED subgroup.
Limited English Proficient Students • LEP Reading • A student enrolled for at least a full calendar year in a U.S. school will meet student participation requirements in reading MSA by taking the Language Acquisition Survey Links(LAS). • LEP Math • A student enrolled for at least a full calendar year in a U.S. school meets student participation requirements in math by sitting for the math MSA.
Limited English Proficient Students • Exited LEP Students • Exited LEP students’ scores on MSA Reading and Math assessments must be included in AYP calculation for the LEP subgroup for two years following their exit from active LEP services. • Exited LEP students’ MSA scores count towards AYP proficiency, not AYP participation.
Identifying the Population MSDE Post Test File Vendor File AYP Student Population
The 3 AYP Indicators… AYP Student Population Reading Math Attendance Performance & Participation
Participation Standard Met? (Minimum “n” count and 95% rule) Participation Full Academic Year Excused w/o Scores Participants Non Participants LEP Exempt Non-Test Takers Standard Met? Yes Performance
Performance Standard Met? Performance data Confidence interval? Overall AMO is the average of the AMOs for all grade levels within School Compared to AMOs OR Minimum count? Preliminary Results to LEA
Appeals Window? Preliminary Results to LEA Appeal Process Data Coding Final Results to LEA Final Results posted to MDReportCard.org
Full Academic Year LEP Exempt Post Test File Vendor File MSDE AYP Student Population Reading Math Attendance Performance & Participation Excused w/o Scores Participants Non Participants Non-Test Takers Preliminary Results to LEA Appeal Process?????? Data Coding Final Results to LEA Final Results posted to MDReportCard.org
Safe Harbor • If a school does not meet the annual performance targets for each subgroup, a provision called Safe Harbor still allows a school to make AYP if the school meets all performance targets in the aggregate, and the subgroup meets the other academic indicator; and the percentage of students achieving below the proficient level in that subgroup decreases by ten percent. Safe Harbor is calculated using the current year’s data compared to the prior year’s data. • The Safe Harbor calculation has three conditions: • School meets at the ALL level • The percentage of students in that subgroup achieving below the proficient level decreases by 10% from previous year • The subgroup meets or exceeds the AMO for the other academic indicator (Attendance Rate)
1% and 2% Rule • The maximum percentage of proficient scores of the total tested population attributed by the: • 1% - AltMSA • 2% - ModMSA At the overall: • LEA • Grade • Content
Sample 1% • LEA XX • Grade 07 • Reading • Test Count: 5170 • Proficiency Cap 1% (for AltMSA) • Max number of proficient scores: 5170 x .01 (rounded up to integer) = 52 • Total AltMSA tested proficient: 57 • Total to be converted: 57 – 52 = 5 The end result… 5 students’ proficient (proficient or advanced) scores will be converted to basic for AYP purposes only. These converted scores will impact all AYP aggregations at all levels within all applicable subgroups.
Sample 2% • LEA XX • Grade 07 • Reading • Test Count: 5170 • Proficiency Cap 2% (for ModMSA) • Max number of proficient scores: 5170 x .02 (rounded up to integer) = 103 • Total ModMSA tested proficient: 109 • 1% Underage = 0 • Total to be converted: 109 – 0 - 103 = 9 The end result… 9 students’ proficient (proficient or advanced) scores will be converted to basic for AYP purposes only. These converted scores will impact all AYP aggregations at all levels within all applicable subgroups.
Impact of 1% and 2% on Proficiency… The conversions of students will be automated… Note: at the subgroup level within a school, the numbers become very small. One converted student can make the difference for any applicable subgroup.
Possible changes for 2011 • New race code (increase in the number of subgroups) • No appeals window • No appeal of student demographic information • No appeal of AYP school • Automation of the 1% and 2% overage re-designations • Confidence Intervals replaced by increased minimum “n” from 5 to ?... • Uptick replaced by growth target?...
Contacts • Doug Strader • dstrader@msde.state.md.us • 410.767.2055 • Matt Dammann • mdammann@msde.state.md.us • 410.767.1628