Download
1 / 1
10 likes | 141 Views
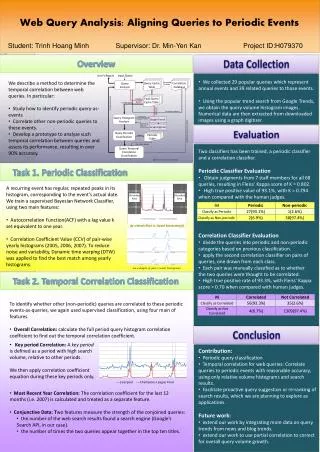
Web Query Analysis: Aligning Queries to Periodic Events Student: Trinh Hoang Minh Supervisor: Dr. Min-Yen Kan Project ID:H079370. User’s Report. Input Query. Query Cache Table. Correlation Database. Query Analysis. Is Exist.

E N D
Web Query Analysis: Aligning Queries to Periodic Events Student: Trinh Hoang Minh Supervisor: Dr. Min-Yen Kan Project ID:H079370 User’s Report Input Query Query Cache Table Correlation Database Query Analysis Is Exist An example of query yearly histograms Fault Query Cache Table Discarded Area Discarded Area Correlation Report Correlation Report Not enough Information Query Histogram Analysis Connect to Google Trends Google Trends Is failed query An original (blue) vs. lagged histogram(red) Is new query Graph Digitizer Update Correlation Database Numerical Reports Query Periodic Classification Periodic Table Update Query suggestion prototype Get other queries Query Temporal Correlation Classification Overview Data Collection • We collected 29 popular queries which represent annual events and 39 related queries to those events. • Using the popular trend search from Google Trends, we obtain the query volume histogram images. Numerical data are then extracted from downloaded images using a graph digitizer. • We describe a method to determine the temporal correlation between web queries. In particular: • Study how to identify periodic query-as-events • Correlate other non-periodic queries to these events. • Develop a prototype to analyze such temporal correlation between queries and assess its performance, resulting in over 90% accuracy. Evaluation • Two classifiers has been trained, a periodic classifier and a correlation classifier. • Periodic Classifier Evaluation • Obtain judgments from 7 staff members for all 68 queries, resulting in Fleiss’ Kappa score of K = 0.802. • High true positive value of 93.1%, with K = 0.794 when compared with the human judges. • Correlation Classifier Evaluation • divide the queries into periodic and non-periodic categories based on previous classification. • apply the second correlation classifier on pairs of queries, one drawn from each class. • Each pair was manually classified as to whether the two queries were thought to be correlated. • High true positive rate of 93.3%, with Fleiss’ Kappa score = 0.70 when compared with human judges. Task 1. Periodic Classification • A recurring event has regular, repeated peaks in its histogram, corresponding to the event’s actual date. • We train a supervised Bayesian Network Classifier, using two main features: • Autocorrelation Function(ACF) with a lag value k set equivalent to one year. • Correlation Coefficient Value (CCV) of pair-wise yearly histograms (2005, 2006, 2007). To reduce noise and variability, Dynamic time warping (DTW) was applied to find the best match among yearly histograms. Task 2. Temporal Correlation Classification • To identify whether other (non-periodic) queries are correlated to these periodic events-as-queries, we again used supervised classification, using four main of features. • Overall Correlation: calculate the full period query histogram correlation coefficient to find out the temporal correlation coefficient. • Most Recent Year Correlation: The correlation coefficient for the last 12 months (i.e. 2007) is calculated and treated as a separate feature. • Conjunctive Data: Two features measure the strength of the conjoined queries: • the number of the web search results found a search engine (Google’s Search API, in our case). • the number of times the two queries appear together in the top ten titles. Conclusion • Key period Correlation: A key period is defined as a period with high search volume, relative to other periods. • We then apply correlation coefficient equation during these key periods only. • Contribution: • Periodic query classification • Temporal correlation for web queries: Correlate queries to periodic events with reasonable accuracy, using only relative volume histograms and search results. • Facilitate proactive query suggestion or re-ranking of search results, which we are planning to explore as applications. • Future work: • extend our work by integrating more data on query trends from news and blog trends. • extend our work to use partial correlation to correct for overall query volume growth.