Download
1 / 9
1.18k likes | 4.25k Views
Module 6 Lab Exercise I: Quality Control and Construction of Levey -Jennings Charts. Levey-Jennings Activity Objectives. At the completion of this activity, you will be able to:

E N D
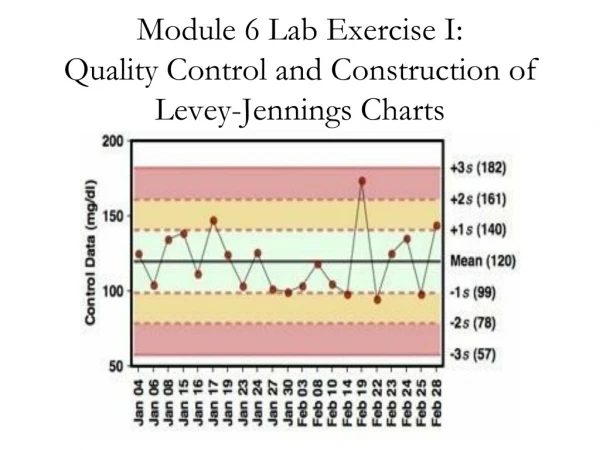
Module 6 Lab Exercise I: Quality Control and Construction of Levey-Jennings Charts
Levey-Jennings Activity Objectives At the completion of this activity, you will be able to: • Perform statistical analysis on analyte values from the previous month’s control values, both normal and abnormal levels, to determine Mean, SD, %CV. • Draw a Levey-Jennings chart, label the x and y axis correctly, and properly label the LJ chart for documentation and filing. • Plot current month’s values daily and evaluate LJ chart for Westgard single rule violations, trends, shifts. • Discuss the necessity of Quality Control Result documentation and how they assess precision and accuracy.
Quality Control Exercise #1 • Quality control sample measurement is used to test the analytical phase of patient testing. • This first exercise provides quality control sample results to calculate statistics and establish a Levey-Jennings chart.
Last Month’s QC Values (Glucose mg/dL)For Establishing the QC Ranges • Calculate the Mean: __________ • Calculate Std Dev: __________ • Calculate %CV: __________ • Determine • + 3 SD Range: ____________ • 5. Construct graph & plot all points
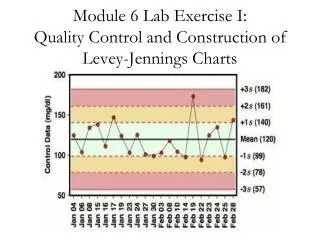
Instrument: _________________ Test: ____________________ Units: ________Method: ____________________ Month/Year: ______________ Tech: ________ Control: ____________________ Lot #: ____________________ Exp: _________Control Mean: _______________ 1 Std Dev: ________________ -+3 SD Range: ___________ + 3s + 2 s + 1 s Mean - 1 s - 2 s - 3 s Days
This is what the LJ Chart should look like including plotted data
Exercise #2Evaluate the following QC chart by identifying out of control data, outliers, shifts, and trends
Key QC Lecture Activity #2 • 3 circled areas and 2 pointers note analytical problems shown by patterns of QC results. What are they?