
포트폴리오와 시장수익률 비교표
포트폴리오와 시장수익률 비교표. 30.00 25.00 20.00 15.00 10.00 5.00 0.00 -5.00 -10.00 -15.00 -20.00. 포트폴리오 수익률 코스피 시장 수익률. 이탈리아 국채 만기. ( 억유로 ). 2,3,4 월에만 1,600 억 유로. 800 700 600 500 400 300 200 100 0.

포트폴리오와 시장수익률 비교표
E N D
Presentation Transcript
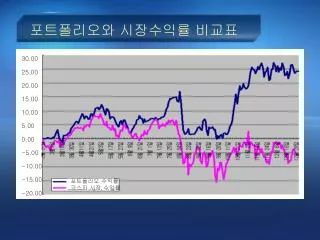
포트폴리오와 시장수익률 비교표 30.00 25.00 20.00 15.00 10.00 5.00 0.00 -5.00 -10.00 -15.00 -20.00 포트폴리오 수익률 코스피 시장 수익률
이탈리아 국채 만기 (억유로) 2,3,4월에만 1,600억 유로 800 700 600 500 400 300 200 100 0 1월 3월 5월 7월 9월 11월
스페인, 아일랜드 CDS (%) (%) 7.0 6.5 6.0 5.5 5.0 4.5 4.0 3.5 3.0 18 16 14 12 10 8 6 4 2 0 스페인 10년 만기 국채(우측) 아일랜드 9년 만기 국채(좌측) 2010년 2011년 2012년
피에스텍 계열회사 지배구조 풍성모터스 대주주 황선태씨 풍성모터스 지분 30% 보유 23.84% 33.44% 23.81% 53.74% 페트라투자자문 덴소풍성 한국덴소판매 피에스텍 100% 49% 덴소풍성전자 풍성전자
덴소풍성의 신성장동력 K3에 적용될 스마트키 K9에적용될 HUD(Head Up Display)
자회사 매출 TPE(천진풍성전자) 매출 중국 내 현대기아차 판매 대수, TPE 판매대수
자회사 매출 TPE(천진풍성전자) 매출 중국 내 현대기아차 판매 대수, TPE 판매대수
자회사 매출 TPE(천진풍성전자) 매출 중국 내 현대기아차 판매 대수, TPE 판매대수