Molecular Luminescence Spectroscopy
690 likes | 1.67k Views
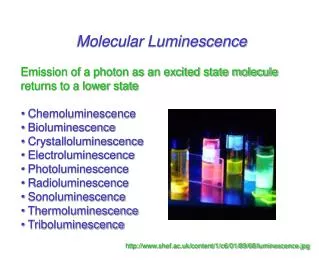
Molecular Luminescence Spectroscopy. Lecture Date: February 4 th , 2013. Luminescent Electronic Processes. Luminescence: radiation produced by a chemical reaction or internal electronic process, possibly following absorption. Includes fluorescence, phosphorescence, and chemiluminescence.

Molecular Luminescence Spectroscopy
E N D
Presentation Transcript
Molecular Luminescence Spectroscopy Lecture Date: February 4th, 2013
Luminescent Electronic Processes • Luminescence: radiation produced by a chemical reaction or internal electronic process, possibly following absorption. Includes fluorescence, phosphorescence, and chemiluminescence. • Fluorescence: absorption of radiation to an excited state, followed by emission of radiation to a lower state of the same multiplicity • Occurs about 10-5 to 10-8 seconds after photon absorption • Phosphorescence: absorption of radiation to an excited state, followed by emission of radiation to a lower state of different multiplicity • Occurs about 10 to 10-5 seconds after photon absorption
History of Fluorescence Spectroscopy • 1845: W. Herschel first observes blue fluorescence from a quinine solution excited by sunlight • 1852: Stokes first explains fluorescence in quinine as arising from frequency differences in light A. Jablonski J. F. W. Herschel • 1900’s: Jablonski develops theory of excited state processes and anisotropy • 1950’s: first fluorescence spectrometers developed at NIH G. G. Stokes J. La kowicz, “Principles of Fluorescence Spectroscopy”, 3rd Ed., Springer, 2006, pg. 2-7.
Molecular Fluorescence • Non-resonant fluorescence is a phenomenon in which absorption of light of a given wavelength by a fluorescent molecule is followed by the emission of light at longer wavelengths (applies to molecules) • Why use fluorescence? One key reason is that it is not a difference method!
Singlet and Triplet States (Two Electron Systems) • Electrons are spin ½ particles • Singlet state: spins are paired, no net angular momentum (and no net magnetic field), one eigenstate ( |0,0 ) • Triplet state: spins are unpaired, net angular momentum (and net magnetic field), three eigenstates (|1,-1 , |1,0, |1,1 )
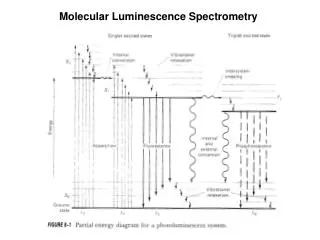
Theory of Molecular Fluorescence • A typical Jablonski energy diagram: • Notation: S2, S1 = singlet states, T1 = triplet state • Fluorescence is a singlet-to-singlet state process; phosphorescence converts the singlet to a triplet state via intersystem crossing • Excitation directly to a triplet state is forbidden by selection rules.
Molecular Fluorescence Terminology • Quantum yield (): the ratio of molecules that luminescence to the total # of molecules • Resonance fluorescence: fluorescence in which the emitted radiation has the same wavelength as the excitation radiation • Internal conversion: after absorption of the photon, molecules in condensed phases often relax to the lowest vibrational level of S1 within 10-12 s • Intersystem crossing: a transition in which the spin of the electron is reversed (change in multiplicity in molecule occurs, singlet to triplet). • Enhanced if vibrational levels overlap or if molecule contains heavy atoms (halogens), or if paramagnetic species (O2) are present. • Dissociation: excitation to vibrational state with sufficient energy to break a chemical bond • Pre-dissociation: relaxation to vibrational state with sufficient energy to break a chemical bond
The Stokes Shift and Mirror Image Rule • Stokes shift: a shift to longer wavelengths between excitation and emitted radiation • Mirror image rule: the FL emission spectrum is the mirror image of the absorption spectrum. The rule is often violated! • The mirror image rule is a consequence of the Frank-Condon principle
Basic Fluorescence Spectrometers • Typical layout of major components Sample Wavelength Selector Monochromator 2 Detector (Photomultiplier tube) 90° angle or front facing geometry Radiation Source and Monochromator 1
Predicting the Fluorescence of Molecules • Some things that improve fluorescence: • Low energy * transitions • Rigid molecules (e.g. biphenyl and fluorene) • Transitions that don’t have competition. Example: fluorescence sometimes does not occur after absorption of UV wavelengths < 250 nm because the radiation has too much energy (>100 kcal/mol). Dissociation occurs instead (but multiphoton excitation may be possible). • Chelation to metals • Intersystem crossings reduce fluorescence (competing process is phosphorescence).
Predicting the Fluorescence of Molecules • More factors that affect fluorescence: • decrease temperature = increase fluorescence • increase viscosity = increase fluorescence • pH dependence for acid/base compounds (titrations) • Calculation of fluorescence using DFT • Possible using modified TDDFT approaches – must include both vibrational and electronic calculations R. Improta et al., J. Phys. Chem. B, 2007, 111, 14080-14082.
Fluorophores • Two major classes: • Intrinsic: the fluorescence occurs naturally in the molecule. The indole group in tryptophan (Trp) residues in proteins absorbs at 280 nm and emits at 340 nm • Extrinsic: the fluorophore is added to a sample. For example, 1-anilinonaphthalene-6-sulfonic acid (ANS) and 2-(para-toluidinyl) naphthalene-6-sulfonic acid (TNS) fluorophores used to non-covalently label proteins. • Types of extrinsic fluorescent species: • Conjugated organic molecules • Lanthanide complexes • Quantum dots • Nanotubes J. La kowicz, “Principles of Fluorescence Spectroscopy”, 3rd Ed., Springer, 2006, pg. 15.
Organic Small Molecule Fluorophores J. La kowicz, “Principles of Fluorescence Spectroscopy”, 3rd Ed., Springer, 2006, pg. 2.
Quantum Dots as Fluorophores • Quantum dots and other nanoparticle semiconductors are a recent addition (~1998) to the world of fluorophores • CdSe and other semiconductors exhibit strong, narrow FL emission with maxima controlled by particle size J. La kowicz, “Principles of Fluorescence Spectroscopy”, 3rd Ed., Springer, 2006, pg. 675-678.
Nanotubes as Fluorophores • Carbon and boron nitride single-walled nanotubes (SWNTs) are currently being explored as red to near infrared fluorophores • SWNTs can be functionalized with groups capable of molecular recognition • Single-molecule emission spectra for carbon SWNTs (n, m): Carbon SWNT n=10, m=10 Length = 49.19 Å L. J. Carlson and T. J. Krauss, Photophysics of Individual Single-Walled Carbon Nanotubes, Acc. Chem. Res., 2008,41, 235-243, http://dx.doi.org/10.1021/ar700136v
Quenching of Fluorescence • Quenching: a process that reduces fluorescence intensity • Collisional: excited state of the molecule is deactivated by collision with another molecule in solution (explained by the Stern-Vollmer equation) • Static: excited state intensity reduced by formation of a complex • Most common (unintentional) quencher – dissolved oxygen (O2) • Quenching of fluorophores is commonly used to probe “accessibility,” e.g. by adding a quencher in varying amounts and observing its effects on a protein fluorophore to determine its location J. La kowicz, “Principles of Fluorescence Spectroscopy”, 3rd Ed., Springer, 2006, pg. 15, pp. 278-286.
Time-Resolved Fluorescence Spectroscopy • Up to this point, we’ve been discussing steady-state fluorescence spectroscopy. • Time-resolved fluorescence spectroscopy: the study of fluorescence spectra as a function of time (usually ps to ns), to measure fluorescence lifetimes () • Demands a different experimental approach than steady-state fluorescence measurements • Two major approaches: • Time domain: sample is excited with a short pulse of light, and the decay in FL is observed. The most common approach is time-correlated single-photon counting (TCSPC). • Frequency domain: sample is excited with amplitude modulated light (typically with a frequency of 100 MHz), causing the emission to respond at the same frequency but delayed by the lifetime of the fluorophore (leading to a phase shift that is measured to get to the lifetime).
Fluorescence Lifetime Measurements • Different species have different lifetimes. Here the Trp residues in a protein, in the presence of a collisional quencher, shows a biexponential decay: J. La kowicz, “Principles of Fluorescence Spectroscopy”, 3rd Ed., Springer, 2006, pg. 101.
Fluorescence Lifetime Measurements • The latest detectors allow for full emission spectra at each time point, which in turns allows for observation of excited state complex formation. • Here a dye is observed to form a charge-transfer (CT) exciplex and then engages in solvent-induced relaxation J. La kowicz, “Principles of Fluorescence Spectroscopy”, 3rd Ed., Springer, 2006, pg. 126.
Fluorescence Anisotropy • Fluorophores prefer to absorb photons with a electric field vector aligned to the electric transition moment of the fluorophore (which is oriented relative to the molecule). • Selective excitation of a subset of fluorophores can be achieved with polarized light, allowing the loss of polarization to be studied. • Time-resolved fluorescence anisotropy is used to study protein-protein interactions and mobility of membrane proteins. J. La kowicz, “Principles of Fluorescence Spectroscopy”, 3rd Ed., Springer, 2006, pg. 12-16..
Resonance Energy Transfer (RET) • The RET (or Fluorescence Resonance Energy Transfer, FRET) method is possible when the emission spectrum of a fluorescent donor and the absorption spectrum of an acceptor (not necessarily fluorescent) overlap. • The RET effect is predicted to have a rate (kT) related to the distance (r) between the donor and acceptor groups: Förster distance The FL lifetime of the donor in the absence of RET J. La kowicz, “Principles of Fluorescence Spectroscopy”, 3rd Ed., Springer, 2006, pg. 15.
Multiphoton-Excited Fluorescence • Known as MPE (as opposed to the usual 1PE) • Lots of energy required, achieved via femtosecond-pulse lasers • Multiple low energy photons can be absorbed, via short-lived “virtual states” (lifetime ~ 1 fs). Can get to far-UV wavelengths without “waste” • Spatial localization is excellent (because of the high energy needed, it can be confined to < 1 m3.) • Applications: primarily bioanalytical microscopy excited state virtual state ground state J. B. Shear, “Multiphoton Excited Fluoroescence in Bioanalytical Chemistry”, Anal. Chem., 71, 598A-605A (1999).
Applications of Fluorescence • Applications in forensics: trace level analysis of specific small molecules • Example: LSD (lysergic acid diethylamide) spectrum obtained with a Fourier-transform instrument and a microscope, but with no derivitization M. Fisher, V. Bulatov, I. Schechter, “Fast analysis of narcotic drugs by optical chemical imaging”, J. Luminesc.. 2003,102–103, 194–200.
Applications of Fluorescence • Applications in biochemistry: analysis of proteins, enyzmes, anything that can be tagged with a fluorophore • In some cases, an externally-introduced label can be avoided. • In proteins, the tryptophan (Trp), tyrosine (Tyr), and phenylalanine (Phe) residues are naturally UV-fluorescent • Example:single -galactosidase molecules from Escherichia coli (Ec Gal) • 1-photon excitation at 266 nm Q. Li and S. Seeger, “Label-Free Detection of Single Protein Molecules Using Deep UV Fluorescence Lifetime Microscopy”. Anal. Chem. 2006, 78, 2732-2737.
Drug Discovery Applications • The inhibition of cytochrome P450 (CYP) enzyme is an indicator of potential drug-drug interactions and drug toxicity. Assays are needed to screen thousands of compounds for CYP inhibition. • Fluorescence assays (usually performed using plate readers) are widely used : • Select a fluorogenic substrate – a poorly-fluorescent molecule that when metabolized by CYP becomes fluorescent. • Mix the substrate, a CYP isozyme, and the candidate drug molecule and incubate. • If fluorescence is reduced, the candidate is interfering with the fluorogenic substrate’s metabolism, and thus is a CYP inhibitor. Image from: http://www.biotek.com/fluorescence-microplate-reader-a.htm Image from J. La kowicz, “Principles of Fluorescence Spectroscopy”, 3rd Ed., Springer, 2006, pg. 30. E. H. Kerns and L. Di, “Drug-Like Properties: Concepts, Structure Design and Methods”, Academic Press, 2008, pg. 197-206.
Fluorescence Recovery after Photo-Bleaching • Fluorescence Recovery After Photo-bleaching (FRAP), first reported in 1974, is a technique for measuring motion and diffusion • FRAP can be applied at a microscopic level. • FRAP is commonly applied to microscopically heterogeneous systems • A high power laser first bleaches an area of the sample, after which the recovery of fluorescence is monitored with the low power laser • Can also use a single laser that is attenuated with a Pockel’s cell • Applications of FRAP have included: • Biological systems • Diffusion in polymers • Solvation in adsorbed layers on chromatographic surfaces • Curing of epoxy resins J. M. Kovaleski and M. J. Wirth, Anal. Chem. 69, 600A (1997).
Fluorescence Recovery After Photo-bleaching • FRAP starts with fluorescence (left-hand image): • A periodic pattern is photobleached with a high power laser (middle image) • The recovery of the fluorescence is monitored via a low power laser (right-hand image) J. M. Kovaleski and M. J. Wirth, Anal. Chem. 69, 600A (1997). B. A. Smith and H. M. McConnell, Proc. Natl. Acad. Sci. USA. 75, 2759 (1978).
Fluorescence Recovery After Photo-bleaching • In spot photobleaching, a spot is bleached, and its subsequent recovery is predicted by: • 1/2 is the time for the fluorescence to recover 1/2 of its intensity • is the diameter of the spot • D is the diffusion coefficient • depends on the initial amount of fluorophor bleached • Periodic pattern photobleaching (depicted on previous slide) eliminates dependence, is more flexible and accurate. Relies on Ronchi rulings or holography • Recovery is given by a simpler equation: • FRAP requires a fluorophore: an organic fluorescent molecule that is photo-bleached (ex. rhodopsin) J. M. Kovaleski and M. J. Wirth, Anal. Chem. 69, 600A (1997). D. E. Koppel, D. Axelrod, J. Schlessinger, E. Elson, and W. W. Webb, Biophys. J. 16, 1315 (1976).
Fluorescence At Sea • NH4+ can be detected at low levels in seawater (for environmental monitoring) using several reactions: • Indophenol blue (Berthelot reaction), LOD = 0.6 M • Ammonia electrode, LOD = 0.2 M • o-phthaldialdehyde (OPA) with sulfite, LOD ~ nM, plus fast kinetics (several minutes) • OPA-sulfite-NH4+ run with a flow-injection system for shipboard use (LOD = 1.1 nM in lab) N. Amornthammarong and J. Z. Zhang, Anal. Chem. 80, 1019-1026 (2008).
Fluorescence At Sea • The result: a M-level “map” of NH4+ off the coast of Florida (shows water quality – too much NH4+ is toxic) N. Amornthammarong and J. Z. Zhang, Anal. Chem. 80, 1019-1026 (2008).
Fluorescence in Solids • Solid powders can be analyzed using powder packed behind a quartz cover slip and held in a vertical position. • Front-facing (but 30 offset) geometries are generally used instead of right angles for maximum signal because the sample cannot emit in all directions. • Example: FL excitation and emission spectra of crystalline diflunisal (Form 1):
Molecular Phosphorescence • Phosphorescence – often used as a complementary technique to fluorescence. • If a molecule won’t fluorescence, sometimes it will phosphoresce • Phosphorescence is generally longer wavelength that fluorescence • Some phosphorimeters are “pulsed-source”, which allows for time-resolution of excited states (which have lifetimes covering a few orders of magnitude). • Pulsed sources also help avoid the interference of Rayleigh scattering or fluorescence. • Instrumentation similar to fluorescence, but with cooling dewars and acquisition delays excitation fluorescence phosphorescence wavelength Note that the wavelength difference between F and P can be used to measure the energy difference between singlet and triplet states
Phosphorescence Studies • Room-temperature Phosphorescence (RTP) • Phosphorescence is performed at low temperatures (77K) to avoid “collisional deactivation” (molecules hitting each other), which causes quenching of phosphorescence signal • By absorbing molecules onto a substrate, and evaporating the solvent, the phosphorescence of the molecules can be studied without the need for low temperatures • By trapping molecules within micelles (and staying in solution), the same effect can be achieved • Applications: • nucleic acids, amino acids, enzymes, pesticides, petroleum products, and many more For more details, see: R. J. Hurtubise, Phosphorimetry: Theory, Instrumentation, and Applications, Chap. 3, New York, VCH 1990.
Chemiluminescence (CL) • A chemical reaction that yields an electronically excited species that emits light as it returns to ground state. • In its simplest form: A + B C* C + h • The radiant intensity (ICL) depends on the rate of the chemical reaction and the quantum yield: ICL = CL (dC/dt) = EX EM (dC/dt) excited states per molecule reacted photons per excited states
Chemiluminescence of Gases • CL reactions can be used to quantitatively analyze gases • Example: Determination of nitrogen monoxide to 1 ppb levels (for pollution analysis in atmospheric gases) Figure from: http://www.shu.ac.uk/schools/sci/chem/tutorials/molspec/lumin1.htm
Chemiluminescence: Luminol Reactions • Luminol, a molecule that when oxidized can do many things… • Representative uses of luminol: • Detecting hydrogen peroxide in seawater1 (indicator of photoactivity)1 • Visualizing bloodstains – reaction catalyzed by haemoglobin2 • Detecting nitric oxide3 Luminol reaction (from Wikimedia commons) luminol 1. D. Price, P. J. Worsfold, and R. F. C. Mantoura, Anal. Chim. Acta, 1994, 298, 121. 2. R. Saferstein, Criminalistics: An Introduction to Forensic Science, Prentice Hall, 1998. 3. J. K Robinson, M. J. Bollinger and J. W. Birks, Anal. Chem., 1999, 71, 5131. See also http://www.deakin.edu.au/~swlewis/2000_CL_demo.PDF
Applications of Chemiluminescence • Detection of arsenic in water: • Convert As(III) and As(V) to AsH3 via borohydride reduction • pH < 1 converts both As(III) and As(V), pH 4-5 converts only As(III) • Reacts with O3 (generated from air), CL results at 460 nm • CL detected via photomultiplier tube down to 0.05 g/L for 3 mL • Portable, automated analyzer, 6 min per analysis • See A. D. Idowu et al., Anal. Chem., 2006,78, 7088-7097. • Chemiluminescence can be applied to fabricated microarrays on a flow chip, allowing for patterned biosensor applications: • See e.g. Cheek et al., Anal. Chem., 2001,73,5777.
Electrochemiluminescence • Electrochemiluminescence (ECL): species formed at electrodes undergo electron-transfer reactions and produce light • ECL converts electrical energy into radiation • This scheme shows both an oxidation and a reduction occuring at an electrode; in most cases a co-reactant is used so that only one electrochemical step is needed M. M. Richter, Chem. Rev.2004,104, 3003-3036
Electrochemiluminescence • ECL luminophores, such as the Ru(bipy)32+luminophore, have been the basis of a wide variety of immunoassays and DNA hybridization assays: W. Miao and A. J. Bard, Anal. Chem. Rev.2003,75, 5825-5834.
Further Reading Required: L. B. McGown, K. Nithipatikom (2000): Molecular fluorescence and phosphorescence, Appl. Spectrosc. Rev. 2000,35, 353-393. Optional: J. Cazes, Ed. Ewing’s Analytical Instrumentation Handbook, 3rd Edition, Marcel Dekker, 2005, Chapter 6. (Note: this is an updated version of the McGown article above). D. A. Skoog, F. J. Holler and S. R. Crouch, Principles of Instrumental Analysis, 6th Edition, Brooks-Cole, 2006, Chapter 15. J. R. Lakowicz, Principles of Fluorescence Spectroscopy, 3rd Edition, Springer, 2006. D. H. Williams and I. Fleming, Spectroscopic Methods in Organic Chemistry, McGraw-Hill (1966). S. Das et al. “Molecular Fluorescence, Phosphorescence, and Chemiluminescence Spectrometry, Anal. Chem. 2012,84, 597–625. M. E. Dias-Garcia, et al., “The triplet state: Emerging applications of room temperature phosphorescence spectroscopy,” Appl. Spectrosc. Rev., 2007,42, 605–624. http://www.horiba.com/us/en/scientific/products/fluorescence-spectroscopy/tutorialswebinars/basic-principles-of-fluorescence-spectroscopy/