Download
1 / 16
180 likes | 299 Views
Mapping of FM and HD Radio Coverage. Brian Casey, Leandro Franca, and Thomas Shanks. April 22, 2009. Project Summary. Measure radio station coverage through: RF Field Strength (conventional method) Signal-to-Noise Ratio of audio (what listeners actually hear) Provide maps of data

E N D
Mapping of FM and HD Radio Coverage Brian Casey, Leandro Franca, and Thomas Shanks April 22, 2009
Project Summary • Measure radio station coverage through: • RF Field Strength (conventional method) • Signal-to-Noise Ratio of audio (what listeners actually hear) • Provide maps of data • Determine statistical information of SNR • Compare results with and without HD
Block Diagram of System Magnetic Mount Whip • BLUE75Ω coax w/ F connector • RED50Ω coax w/ UHF connector • GREENData connector • BLACK Audio cable RCA to 1/8”
Transmission of Test Tones Silence 250 ms Silence 250 ms 1 kHz 250 ms 1 kHz 250 ms • 100% modulation, stereo on, other sub-carriers and processing off • Enable/Disable HD • Interrupts programming, so time of tests 1:30 - 6:00 am
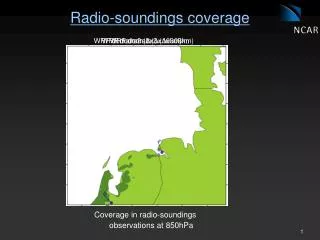
RF Power Map (dBm)
Driving Path Full path Validation Path
Demonstration • Show working automated system (test drive) • Describe functionality of sub systems • Provide data plots and distribution information
Remaining Work • Post-processing software to create maps • Implementation of NI Sound and Vibration Toolkit for SNR and ITU-468 Filter • Calibrate and Validate SNR • Drive Path • Compare with and without HD • Plot final data • Prepare documentation and post everything on site
Future Work • Full coverage drive • Calibrated antenna to determine field strength from dBm measurements • Use truly representative radios • Analyze time and environmental variances of signal