
Acknowledgements
A Tree-Thinking Curriculum For Introductory Biology J. Phil Gibson & Mariëlle Hoefnagels Department of Botany & Microbiology, Department of Zoology, University of Oklahoma , Norman, OK 73019. Conclusions

Acknowledgements
E N D
Presentation Transcript
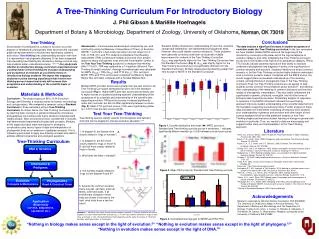
A Tree-Thinking Curriculum For Introductory Biology J. Phil Gibson & Mariëlle Hoefnagels Department of Botany & Microbiology, Department of Zoology, University of Oklahoma, Norman, OK 73019 Conclusions The data indicate a significant increase in student acceptance of evolution under the Tree-Thinking curriculum. In the four semesters we have studied, median MATE scores at the beginning of the introductory course are at the lower end of the high acceptance of evolution category, and, after completing the Tree-Thinking curriculum, scores are in the middle of the high level of acceptance category. TRA & TTCI results indicate students improved in their ability to read and understand phylogenetic tree diagrams in terms of the significance of common ancestry and evolution. Students initially know what a common ancestor is, but the Tree-Thinking curriculum helps students understand what a common ancestor means. Combined with the MATE scores, the results suggest there is increased understanding of the meaning, content, and significance of phylogenetic trees in the Tree-Thinking curriculum Thus, the Tree-Thinking modules we use appear to help students correct common misconceptions about evolution11 and develop their understanding of the meaning of common ancestors and how that relates to phylogenetic interpretation. They also better understand the significance of genetic, structural, ecological, and all other forms of biological data supporting evolution. Preliminary analysis of responses to questions in the MATE instrument indicates the tree-thinking approach improves student understanding of the scientific data that form the foundation supporting evolutionary theory. Further analysis of these data and data from instruments evaluating introductory-level students’ prior understanding of genetics and evolution and other facets of their science background will provide additional insights on how Tree-Thinking shapes and improves student learning of biology in general and evolution in particular. Thus, our results to data are encouraging and suggest further study and implementation of the Tree-Thinking approach. Tree-Thinking Since Darwin first sketched his concept of evolution as a tree diagram in Notebook B, phylogenetic trees have become important graphical representations of evolutionary hypotheses, patterns, and history. Tree-thinking links understanding evolution with how it is represented in phylogenetic diagrams. It has been suggested that integrating tree-thinking into introductory biology curricula may help students better understand evolution.1,2,3,6,10Our study tests whether an introductory biology curriculum organized around a central theme of tree-thinking will increase understanding and acceptance of evolution as a scientific theory in introductory biology students. We expect that engaging students in active learning experiences that involve tree-thinking across hierarchical levels will increase their acceptance and understanding of the scientific basis of evolution. Students initially showed poor understanding of how time, character change and relatedness are represented in phylogenetic trees. However, they could identify common ancestors. These problems were generally corrected under both curricula with notable improvement for students in the Tree-Thinking Curriculum. GMATEwas significantly higher for the Tree-Thinking Curriculum than the Standard Curriculum (Fig. 3). GTRA was slightly higher for the Tree-Thinking Curriculum but not significantly different from the Standard Curriculum. All Gain values were significantly greater than zero except for MATE in the Standard Curriculum. Assessment – Curricula were assessed and compared by pre- and post-testing using the Measure of Acceptance of Theory of Evolution (MATE) 12 a 20-item, Likert-scale instrument (scores range from 0 100). In F09, S10, and F10 students completed a Tree Reading Assessment (TRA) containing 6 multiple choice and short answer questions about phylogenetic trees and their interpretation (similar to the Test Your Tree Thinking questions) to measure tree-thinking skills.3,10 In S11, TRA was replaced by a 14 question (28 point) Tree Thinking Concept Inventory8. Average normalized gain was calculated for MATE (GMATE), TRA (GTRA), and TTCI (GTTCI).7 Pre- and post MATE, TRA, and TTCI scores were compared via Wilcoxon Signed Ranks Test, and Gain compared with a Kruskal-Wallace Test. Results Median MATE post-test scores were greater than pre-test scores in all Tree-Thinking Curriculum semesters but were not in the Standard Curriculum (Fig.1). Higher MATE post-test scores were primarily due to higher scores on questions probing students’ understanding of the acceptance of by scientists and understanding of the scientific data supporting evolution. TRA post-test scores increased significantly under both curricula, but did not differ significantly between curricula (Fig. 2). MeanTTCI post-test scores (7.22) were significantly greater (p < 0.001) than pre-test scores (20.60). Materials & Methods Curriculum – The study focuses onBIOL 1134 (Evolution, Ecology, and Diversity) a required course for botany, microbiology, and zoology majors. We compared a semester using a Standard Curriculum to three semesters using a Tree-Thinking Curriculum. As shown below, the Tree-Thinking Curriculum starts by teaching basic concepts of genetics followed by inheritance and pedigrees (noncontroversial topics students understand and readily accept). Next, evolutionary theory is presented in modules that demonstrate fundamental principles and concepts. Modules at this stage also basic teach techniques for phylogeny construction using various types of data and interpretation of phylogenetic trees as an extension of pedigree concepts. This is followed opportunities to apply tree-thinking concepts and skills to address different organismal and ecological questions. Test Your Tree-Thinking Tree-thinking quizzes identify specific misconceptions and deficient skills that can be targeted to improve evolution education.3,10 Figure 1. Quartile distribution and mean () MATE scores for Standard and Tree-thinking curricula across 4 semesters. * indicates significantly different median (p < 0.05) between pre and post scores. Literature 1Alters, B.J. and C.E. Nelson. 2002. Perspective: Teaching evolution in higher education. Evolution 56: 1891-1901. 2Baum, D. A., and S. Offner. 2008. Phylogenies and tree-thinking. The American Biology Teacher 70: 222-229. 3Baum, D. A., S. D. Smith, and S. S. Donovan. 2005. Evolution. The tree-thinking challenge. Science 310: 979-980. 4Bishop, B. A., and C. W. Anderson. 1990. Student conceptions of natural-selection and its role in evolution. Journal of Research in Science Teaching 27: 415-427. 5Dobzhansky, T. 1973. Nothing in biology makes sense except in the light of evolution. American Biology Teacher 35: 125-129. 6Gregory, T. R. 2008. Understanding evolutionary trees. Evolution Education Outreach 1:121-137. 7Hake, R. R. 2002. Lessons from the physics education reform effort. Conservation Ecology, 28. 8Halverson Tree-Thinking Concept Inventory 9Kalinowski,S.T., M.J. Leonard, & T.M. Andrews. 2010. Nothing in evolution makes sense except in the light of DNA. CBE Life Science Education 9(2): 87-97 10Meir, E., J. Perry, J. C. Herron, and J. Kingsolver. 2007. College students’ misconceptions about evolutionary trees. American Biology Teacher 69: 71-76. 11Nehm, R. H., and L. Reilly. 2007. Biology majors' knowledge and misconceptions of natural selection. Bioscience 57: 263-272. 12Rutledge, M. L. K. C. Sadler. 2007. Reliability of the Measure of Acceptance of the Theory of Evolution (MATE) instrument with university students. The American BiologyTeacher 69: 332-335. 13Society of Systematic Biologists. 2002. http://systbiol.org/ 1. In diagram A, are lizards more closely related to frogs or humans? 2. In diagram A, are fish more closely related to frogs or mice? In B, are fish more closely related to frogs or lizards. A B Tree-Thinking Curriculum DNA & Genetics 3. What does the letter x indicate? Inheritance & Pedigrees Figure 2. Mean TRA scores for Standard and Tree-thinking curricula. 4. Are humans equally related to frogs in both diagram A and B? Evolution Concepts & Mechanisms Phylogenetics Read & Construct Trees 5. Assume the common ancestor had a long tail, ear flaps, external testes, and fixed claws. If all evolutionary changes in these traits are shown in the tree at the right, what traits does a sea lion have? Acknowledgements Research supported by National Science Foundation DUE #0940835, The University of Oklahoma College of Arts and Sciences, The Department of Botany and Microbiology, and The Department of Zoology. Thanks to M. Jones, J. Cooper, S. Rhodes, A. Makowicz, C. Poindexter, M. Gibson, D. Washecheck. Research conducted under University of Oklahoma IRB #12682 Application (Biodiversity surveys, adaptations, speciation etc.) Answers:1. Humans, they share a more recent common ancestor. 2. Equally related to all in both diagrams via same shared common ancestor (y). 3. X is the last common ancestor to frogs, lizards, mice, & humans. 4. Yes. the relationships in both diagrams are the same for all taxa. 5. Short tail, ear flaps, abdominal testes, & fixed claws. Figure 3. Normalized learning gain for MATE and TRA/TTCI. “Nothing in biology makes sense except in the light of evolution.5” “Nothing in evolution makes sense except in the light of phylogeny.13” “Nothing in evolution makes sense except in the light of DNA.9”


