Download
1 / 25
250 likes | 397 Views
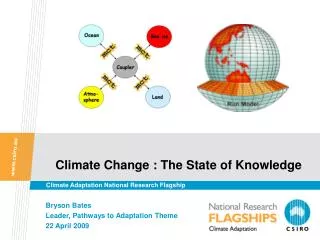
Climate Change : The State of Knowledge. Climate Adaptation National Research Flagship. Bryson Bates Leader, Pathways to Adaptation Theme 22 April 2009. Presentation outline. Human vs geological time scales Observed global trends Observed national trends Climate change projections for WA

E N D
Climate Change : The State of Knowledge Climate Adaptation National Research Flagship Bryson Bates Leader, Pathways to Adaptation Theme 22 April 2009
Presentation outline • Human vs geological time scales • Observed global trends • Observed national trends • Climate change projections for WA • Extremes • Concluding remarks
Climate has always changed NewScientist, 2008
Geologic & human time scales • Past super-greenhouse conditions: • 50 My BPCO2~ 1,000 ppm; no polar ice; sea level ~ 120 m above present • 250 My BPCO2~ 10 to 20 x present level (~ 385 ppm); 50 to 95% extinction rate • Advent of humans ~ 2.2 to 2.4 My BP • Civilisation started ~ 12 Ky BP • Current rate CO2 increase 200 x faster than that over last 650 Ky • Without mitigation & abatement, burning all known coal reserves will raise atmospheric CO2~ 2,000 ppm • Estimated arrival time for next ice age: ‘now’ to 20 Ky
Enhanced greenhouse effect • GHGs are a natural part of the atmosphere: support life • Water vapour is most abundant GHG: humans have littleimpact • Humans have most impact on CO2, CH4, N2O: net effect
2007 2006 2005 Global fossil fuel emissions SRES (2000) growth rates in % y -1 for 2000-2010: A1B: 2.42 A1FI: 2.71 A1T: 1.63 A2: 2.13 B1: 1.79 B2: 1.61 Observed 2000-2006 3.3% Global Carbon Budget update; Raupach et al. 2007, PNAS
Rahmstorf et al. (2007) Observations vs IPCC projections
Observations vs IPCC projections Rahmstorf et al. (2007)
Lags in the response of climate to emissions IPCC 2001, SYM, Figure 8.3
Past 12 years have been unusual Very wet in the north & west Very dry over southeast Qld, southern NSW and SA, Victoria, eastern Tas and southwest WA Feb 1997 – Jan 2009 CSIRO Climate change: the latest science
Temperature projections (2050) Winter Summer A1F1 B1 A1B B1 A1B A1FI 23 GCMs;1980–1999 baseline Source: http://www.climatechangeinaustralia.gov.au/
Wind speed projections (2050) Winter Summer B1 A1B A1F1 B1 A1B A1FI 23 GCMs;1980–1999 baseline Source: http://www.climatechangeinaustralia.gov.au/
Rainfall projections (2050) Winter Summer B1 A1B A1F1 B1 A1B A1FI 23 GCMs;1980–1999 baseline Source: http://www.climatechangeinaustralia.gov.au/
Specific projections • SW rainfall projected to decrease by 2 to 20% by 2030 & 5 to 60% by 2070 • SW summer temperatures projected to increase between 0.5 to 2.1 ºC by 2030 & 1 to 6.5 ºC by 2070 • Average annual number of days above 35 ºC in Perth to increase from 28 to 36-67 by 2070 • SW winter temperatures projected to increase between 0.5 & 2 ºC by 2030 & 1 & 5.5 ºC by 2070
Potential impacts of climate change Greater risks to major infrastructure due to increases in extreme weather events More damage to buildings; transport, energy & water services; telecommunications More heat-related deaths for people aged over 65 1115 deaths per year at present in the 5 largest capital cities, increasing to 2300-2500 per year by 2020 Greater risks for coastal flooding from sea-level rise and storm surges (global sea level rise of 1 metre or more possible by 2100)
Key points on weather & climate extremes • Infrequent events at either the low or high end of a variable of interest – low probability, high impact • Small change in average of a variable can be accompanied by large changes in I-F-D characteristics • Wide range possible within unchanging climate – difficult to attribute individual event to climate change
Climate change & extremes How will changes in extremes be manifested?
Rainfall extremes • Occur on different scales in space-time • intermittent processes • poor observations • Not 'resolved' by computational grids in GCMs – need 'downscaling' methods • topographic effects • coastal effects • subgrid-scale processes (e.g. convection) • Changes do not scale with specific humidity changes: more complex • Statistics vary over a range of time scales (temporal clustering) • Changes in rainfall means cannot be used to reliably infer changes in extremes
200 km 65 km 4 km fraction 2030 2070 Value added by dynamical downscaling
Concluding remarks • Our climate will continue to change due to natural & human-induced forcing • Present evidence for climate change is compelling • Prognosis for WA is hotter, & drier for SW (NW uncertain) • Climate/weather extremes – difficult topic & an active area of research • Believe/disbelieve – stay informed & manage the risk • Future management strategies will need to be: • adaptive rather than static • based on a scenario & portfolioapproach