Download
1 / 16
160 likes | 279 Views
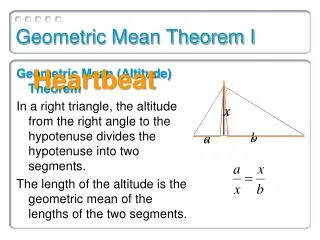
A Matched-Model Geometric Mean Price Index for Supermarket Scanner Data. Nicolette de Bruijn Peter Hein van Mulligen Jan de Haan Sixth EMG Workshop, 13 – 15 December 2006, UNSW, Sydney. Contents. Historical overview Advantages of using scanner data Daily practice Matched-model approach

E N D
A Matched-Model Geometric Mean Price Index for Supermarket Scanner Data Nicolette de Bruijn Peter Hein van Mulligen Jan de Haan Sixth EMG Workshop, 13 – 15 December 2006, UNSW, Sydney
Contents • Historical overview • Advantages of using scanner data • Daily practice • Matched-model approach • Simulations on scannerdata and results • Conclusions • Future plans
Historical overview • 2002 • Introduction of use of scanner data in the CPI - 2 main supermarket organisations - field observations in these chains were cancelled • 2005 • Base year shift to 2004 and some improvements • 2007 • Base year shift to 2006 • 1 supermarket
Advantages of using scanner data (1) • Improving quality: • Large numbers of items • Average real transaction prices • No more observation mistakes • Detailed and better weights • Efficiency: • Less survey work in the field • Less administrative burden for retailers
Advantages of using scanner data (2) • More articles in scanner data than field survey articles: abundance of scanner data • Descriptions of articles in scanner data are narrower than descriptions for field survey articles
Use of the data • EANs: unique products • EANs must be classified (COICOP/CBL) • All data are used for construction of weights • Weights per EAN on basis of turnover shares • New basket and new weights each year • Prices: unit values per EAN per supermarket • Laspeyres index per COICOP/CBL-group per supermarket • Scanner data indexes are aggregated with indexes based on field surveys for other supermarkets and shop types
Why this study? • The current method is time-consuming - classification of EANs into CBL/COICOP-groups - choosing successors for disappearing EANs • Therefore it is impossible to use more scanner data from other supermarkets • CBS would like to scale up on scanner data of supermarkets • A more efficient method is needed matched model without explicit QA
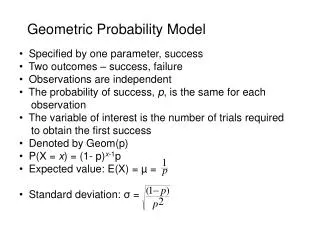
Differences between current method and proposed method • Geometric mean vs. Arithmetic mean • Explicit QA vs. class mean imputation • Fixed weight per EAN vs. no weights • Fixed basket vs. monthly basket
Benchmark versus scenario 1 • Benchmark: CBL index on basis of geometric mean • Scenario 1: CBL index on basis of arithmetic mean (current situation) • Advantages of geometric mean: - substitution, less sensitive in heterogenic groups
Scenario 2: disappearing EANs • About 100 disappearing EANs per month • Imputation for unimportant EANs • Important EANs are ‘replaced’ by hand • possibility to correct explicitly for quality changes • Finding successors and applying explicit quality corrections is time-consuming • Scenario 2: no explicit quality adjustments but average index change of CBL-group
Scenario 3: weights • Scenario 3: no explicit weights are used, each EAN gets the same weight • Problems scenario 3: weights are required because of heterogeneity within CBL-groups • Equal weighting yields unacceptable differences for CBL- and COICOP-groups • But fixed weights are necessary, as monthly weights result in an upward drift
Matched-model simulation • Monthly basket of matched EANs • Geometric mean and no explicit adjustments for quality changes • Using monthly weights or no weights at all is not appropriate, therefore: rough weighing • Sample on basis of turnover shares per CBL-group • Variation in coverage: 60%, 70%, …, 95% • NB: simulation on (official) ‘basket items’
Conclusions • When the process is fully automated we can scale up the amount of supermarket scanner data • Classifying EANs into COICOP/CBL-groups will remain time consuming; a solution has to be found before scaling up
The future • 2007 • Pilot study: implementation of matched model approach for 2 supermarkets to detect practical and logistic difficulties • 2008 • Matched-model geometric mean index in production • Reduction of field surveys in supermarkets