Slide Note
0 likes | 37 Views
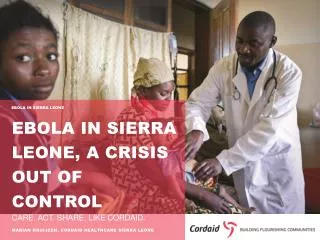
Sierra Leone continues to face high child mortality rates, with many deaths occurring at home without medical attention. The national survey reveals a significant number of deaths among children aged 0-14 years, with leading causes including birth asphyxia, severe systemic infections, and low birth weight/preterm births. The study also highlights regional variations in mortality rates and the need for targeted interventions to address specific causes of deaths among neonates and young children.

E N D
Child mortality in Sierra Leone: Nationally representative mortality survey Catherine Meh, MPH MSc On behalf of HEAL Sierra Leone Child mortality Team
Background • High mortality rates in Sierra Leone expose the burden of premature deaths (death before age 70 years) • Many deaths occur at home without medical attention or cause of death documentation • Sierra Leone’s life expectancy at birth was 55 years in 2020 • Population ~ 8.1M
Methodology National livebirths and deaths 2022 • Sex-specific national absolute deaths and livebirths were derived using 2022 UN World Population Prospects for children • 0-4 years • 5-14 years • UNICEF 2020 stillbirth estimates and 2021 estimate for neonatal mortality • Neonates using neonatal mortality rate • 1 month to 4 years
Total child deaths in Sierra Leone, 2022 • Stillbirths - 4,754 • Child (0-14 years) deaths - 30,609 – Neonates - 8,107 – Under five (minus neonates) - 18,797 – 5 – 14 years - 3,705
Study deaths in Sierra Leone % of total deaths 5.0 10.8 64.7 19.4 Age group Stillbirth Neonate 0-28 days 1-59 month Child 5-14 years Female 122 242 1,609 418 Male 129 301 1,632 553 Total 251 543 3,241 971 Eastern North Western North Eastern Southern Western 15.6 10.09 19.06 47.44 7.81 370 246 478 1,120 177 411 259 476 1,255 214 781 505 954 2,375 391 Rural Urban 69.92 30.08 1,703 688 1,797 818 3,500 1,506 Total 100 2,391 2,615 5,006
Stillbirths National Estimates Perinatal 33.12 % Study deaths 251 National total 4754 Mortality rate (1000 births) 17.6 (17.1 – 18.1) % Male 51.39% Rural 70.12% Hospital or Health facility death 79.08% Deaths at home 14.3% Full term gestation 78.5% Maceration 24%
Stillbirths - Regional Eastern North West North East Southern Western Perinatal % 35.5 33.1 40.0 30.6 26.4 Male % 64.1 59.1 47.2 50 40 Rural % 82.1 90.9 86.1 63.3 0 Hospital or Health facility death % 84.6 81.8 66.7 84.7 85 Deaths at home % 5.1 13.64 30.6 7.14 10 Full term gestation 89.8 86.4 69.4 78.6 80 Maceration % 15.4 50 29.2 14.3 45 Total stillbirths 39 22 72 98 20
Leading causes of neonatal deaths - Sierra Leone 1% 2% 3% 13% 33% 21% 27% Birth asphyxia and birth trauma Other perinatal conditions Congenital anomalies Severe Systemic Infection Acute respiratory infections Low birth weight/preterm Malaria
Neonatal cause specific mortality rates Mortality rate per 1000 livebirths (95% CI) Study deaths (female/male) National estimate Cause of death % Total Birth asphyxia and birth trauma 174 (70/104) 2664 32.9 10.1 (9.7-10.5) Severe Systemic Infection 142 (68/74) 2128 26.2 8 (7.7-8.4) Low birth weight/preterm 110 (57/53) 1533 18.9 5.8 (5.5-6.1) Other perinatal conditions 67 (24/43) 984 12.1 3.7 (3.5-4) Acute respiratory infections 16 (9/7) 193 2.4 0.7 (0.6-0.8) Malaria 13 (3/10) 262 3.2 1 (0.9-1.1) Congenital anomalies 7 (5/2) 116 1.4 0.4 (0.4-0.5) Diarrhoea 3 (1/2) 51 0.6 0.2 (0.1-0.3) Other infectious diseases 3 (1/2) 46 0.6 0.2 (0.1-0.2) Tetanus 2 (0/2) 45 0.5 0.2 (0.1-0.2) Epilepsy 1 (1/0) 23 0.3 0.1 (0.1-0.1) Falls 1 (0/1) 15 0.2 0.1 (0-0.1) other Ill-defined and abnormal findings 1 (1/0) 16 0.2 0.1 (0-0.1) Other neuropsychiatric disorders 1 (1/0) 22 0.3 0.1 (0.1-0.1) Road traffic accidents 1 (0/1) 2 0.0 0 (0-0) Severe Localized Infection All causes of death 1 (1/0) 8 0.1 0 (0-0.1) 30.7 (30-31.3) 543 (242/301) 8107 100.0
Neonatal Eastern North West North East Southern Western Sierra Leone Male % 54.4 46.3 55.1 56.5 61.1 55.4% Rural % 70.6 87.0 81.3 85.5 7.4 62.2% Hospital or Health facility death % 60.3 51.9 56.1 64.2 77.8 62.3% Deaths at home % 30.9 38.9 40.2 31.2 20.4 32.6% Full term gestation % 92.2 88.2 81.3 87.5 83.3 85.6% Mortality rate per 1000 livebirths 33.2 29.3 28.5 37.3 23.0 30.7% Study deaths (n) 68 54 107 260 54 543 Total deaths 1896 1704 1191 2211 1105 8107
Regional variation for neonatal deaths Leading causes of death Mortality rate per 1000 livebirth 8.8 11.7 10.1 Region Southern Eastern National Birth asphyxia and birth trauma North Eastern Southern National 3.4 12.2 8.0 Severe Systemic Infection Eastern North Eastern National 3.8 7.6 5.8 Low birth weight/preterm *About 74% of neonatal deaths were children who died < 1 week. 46% died on day 0/1
Leading (%) causes of death among 1-59 month old children, 2022 Malaria 41.35 Other infectious diseases 23.08 Diarrhoea 7.65 Acute respiratory infections 7.28 Meningitis/encephalitis 2.22 Fever of unknown origin 1.54 Epilepsy 1.48 Unspecified deaths 1.39 Other unintentional injuries 1.33 Other digestive diseases 1.11 Measles 1.11 Other perinatal conditions 1.08 0 5 10 15 20 25 30 35 40 45
Cause specific mortality rates for 1-59 months, 2022 Study deaths (female/male) National estimate Mortality rate per 1000 LB (95% CI) Cause of death % Total (wgtd) Malaria 1340 (663/677) 7923 42.2 30 (29.3-30.6) Other infectious diseases 748 (371/377) 4478 23.8 16.9 (16.5-17.4) Diarrhoea 248 (121/127) 1459 7.8 5.5 (5.2-5.8) Acute respiratory infections 236 (118/118) 1162 6.2 4.4 (4.2-4.7) Meningitis/encephalitis 72 (36/36) 339 1.8 1.3 (1.2-1.4) Fever of unknown origin 50 (25/25) 307 1.6 1.2 (1-1.3) Epilepsy 48 (33/15) 281 1.5 1.1 (0.9-1.2) Unspecified deaths 45 (18/27) 281 1.5 1.1 (0.9-1.2) Other unintentional injuries 43 (23/20) 244 1.3 0.9 (0.8-1) Measles 36 (20/16) 192 1.0 0.7 (0.6-0.8) Other digestive diseases 36 (16/20) 222 1.2 0.8 (0.7-1) Other perinatal conditions 35 (17/18) 175 0.9 0.7 (0.6-0.8) Other Ill-defined and abnormal findings 27 (18/9) 158 0.8 0.6 (0.5-0.7) HIV/AIDS 25 (12/13) 147 0.8 0.6 (0.5-0.7) Hepatitis 20 (10/10) 91 0.5 0.3 (0.3-0.4) Protein-energy malnutrition 19 (13/6) 90 0.5 0.3 (0.3-0.4) 3241 All causes (1609/1632) 18797 100.0 71.1 (70.1-72.1)
Regional variation - 1-59 months Eastern North West North East Southern Western Sierra Leone Male % 51.7 46.1 48.0 51.2 53.5 50.4 Rural % 72.1 91.8 85.0 70.5 4.4 70.9 Hospital or Health facility death % 46.9 34.1 40.4 45 54.4 44.1 Deaths at home % 42.2 54.3 50.3 46.5 34.1 46.4 Mortality rate per 1000 livebirths 77 67.9 66 86.6 53.4 71.1 Study deaths (n) 516 317 594 1588 226 3241 Total deaths 4396 3952 2761 5128 2561 18797
Regional variation for deaths among 1-59 months Leading causes of death Mortality rate per 1000 livebirth 42.1 19.9 30.0 Region Southern Western National Malaria Eastern North Eastern National 24.6 12.8 16.9 Other infectious diseases North Western Western National 8.4 2.9 5.5 Diarrhoea Southern Eastern National 7.0 2.1 4.4 Acute respiratory infections
Leading (%) causes of death among 5-14 year old children Malaria 34.29 Other infectious diseases 12.26 Diarrhoea 8.03 Sickle-cell 3.6 Falls 3.3 Acute respiratory infections 3.19 Other digestive diseases 2.78 Drownings 2.57 Hepatitis 2.27 Meningitis/encephalitis 2.16 Epilepsy 2.16 Road traffic accidents 1.85 Other unintentional injuries 1.75 Gastro-oesophageal 1.65 Severe Localized Infection 1.44 0 5 10 15 20 25 30 35 40
Causes of death among children 5-14 years in Sierra Leone, 2022 Study deaths (female/male) National estimate Mortality rate (95% CI) COD % Total (wgtd) Malaria 333 (146/187) 7923 42.2 59.7 (56.5-63.1) Other infectious diseases 119 (66/53) 4478 23.8 22.5 (20.5-24.6) Diarrhoea 78 (27/51) 1459 7.8 13.7 (12.2-15.3) Sickle-cell 35 (18/17) 1162 6.2 7.6 (6.5-8.9) Falls 32 (7/25) 339 1.8 5.1 (4.2-6.1) Acute respiratory infections 31 (17/14) 307 1.6 4.4 (3.6-5.4) Other digestive diseases 27 (9/18) 281 1.5 6 (5-7.1) Drownings 25 (6/19) 281 1.5 3.9 (3.1-4.8) Hepatitis 22 (7/15) 244 1.3 4 (3.2-4.9) Epilepsy 21 (10/11) 192 1.0 2.7 (2.1-3.5) Meningitis/encephalitis 21 (8/13) 222 1.2 3.5 (2.8-4.4) Road traffic accidents 18 (6/12) 175 0.9 2.9 (2.2-3.7) Other unintentional injuries 17 (5/12) 158 0.8 3 (2.3-3.8) Gastro-oesophageal 16 (6/10) 147 0.8 2.4 (1.8-3.2) Severe Localized Infection All causes 14 (7/7) 91 0.5 2.6 (2-3.4) 971 (418/553) 18797 100.0 173.5 (168-179.2)
Regional variation for deaths among 5-14 year old children Leading causes of death Mortality rate per 100,0000 65.3 47.7 59.7 Region Southern Eastern National Malaria Eastern Southern National 36.0 11.9 22.5 Other infectious diseases North Western Eastern National 44.1 7.7 13.7 Diarrhoea
Implications • Evidence to evaluate current priorities • Malaria is the leading cause of death for all children except neonates • Efforts towards stillbirth reduction • Over 80% of child deaths are among 0-4 year old children • Useful evidence from SL-SRS for premature deaths reduction in Sierra Leone


![[PDF] Free Download The Christmas Scorpion By Lee Child](https://cdn4.slideserve.com/8028194/slide1-dt.jpg)

![[PDF] Free Download Cleaning the Gold By Karin Slaughter & Lee Child](https://cdn4.slideserve.com/8302509/slide1-dt.jpg)
![[PDF] Free Download Blue Moon By Lee Child](https://cdn4.slideserve.com/8455849/slide1-dt.jpg)


![[Best!] Chevrolet Silverado GMC Sierra/Sierra Denali 1500 (07-13) 2500 HD 350](https://cdn5.slideserve.com/11181999/best-chevrolet-silverado-gmc-sierra-sierra-denali-dt.jpg)