Part V: Unsupervised Learning and Clustering
370 likes | 696 Views
Part V: Unsupervised Learning and Clustering. NASA Space Program. Unsupervised Learning or Clustering. Previously, each data point had a class label this is “supervised learning” in many problems there are no class labels this is “unsupervised learning”

Part V: Unsupervised Learning and Clustering
E N D
Presentation Transcript
Part V: Unsupervised Learning and Clustering NASA Space Program
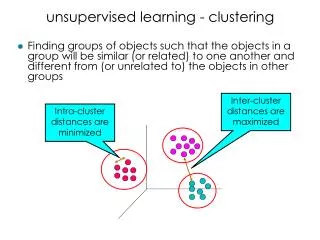
Unsupervised Learning or Clustering • Previously, each data point had a class label • this is “supervised learning” • in many problems there are no class labels • this is “unsupervised learning” • human learning: how do we form categories of objects? • Humans are good at creating groups/categories/clusters from data • in scientific data analysis finding groups in data is very useful • e.g., finding genes that have similar properties • e.g., finding galaxies that look the same
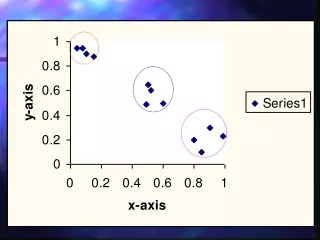
Example: Data in 2 Clusters Feature 2 Feature 1
The Clustering Problem • Let x = (x1, x2,…, xd) be a d-dimensional feature vector • Let D be a set of x vectors, • D = { x(1), x(2), ….. x(N) } • Given data D, group the N vectors into K groups such that the grouping is “optimal” • One definition of “optimal”: • Let mean_k be the mean (centroid) of the Kth group • Let d_i be the distance from vector x(i) to the closest mean • so each data point x(i) is assigned to one of the K means
Optimal Clustering • Let mean_k be the mean (centroid) of the kth cluster • mean_k is the average vector of all vectors x “assigned to” cluster k • mean_k = Sx(i), • where the sum is over x(i) assigned to cluster k • One definition of “optimal”: • Let d_i be the distance from vector x(i) to the closest mean • so each data point x(i) is assigned to one of the K means • Q_k = quality of cluster k = S d_i , • where the sum is over x(i) assigned to cluster k • the Q_k’s measure how “compact” each cluster is • We want to minimize the total sum of the Q_k’s
The Total Squared Error Objective function • Let d_i = distance from feature vector x(i) to the closest mean = squared Euclidean distance between x(i) and mean_k • Now Q_k = sum of squared distances for points in a cluster • Total Squared Error (TSE) • TSE = Total Squared_Error = S Q_k • where sum is over all K clusters (and each Q_k is itself a sum) • TSE measures how “compact” a clustering is
Example: Data in 2 Clusters Feature 2 Feature 1
“Compact” Clustering: Low TSE Feature 2 Cluster Center 2 Cluster Center 1 Feature 1
“Non-Compact” Clustering: High TSE Feature 2 Cluster Center 2 Cluster Center 1 Feature 1
The Clustering Problem • Let D be a set of x vectors, • D = { x(1), x(2), ….. x(N) } • Fix a value for K, e.g., K = 2 • Find the locations of the K means that minimize the TSE • no direct solution • can use an iterative search algorithm to minimize TSE
The Algorithm for K-means Clustering Inputs: data D, with N feature vectors K = number of clusters Outputs: K mean vectors (centers of K clusters) memberships for each of the N feature vectors
The Algorithm for K-means Clustering kmeans(D, k) choose K initial means randomly (e.g., pick K points randomly from D) while means_are_changing % assign each point to a cluster for i = 1: N membership[x(i)] = cluster with mean closest to x(i) end % update the means for k = 1:K mean_k = average of vectors x(i) assigned to cluster k end % check for convergence if (new means are the same as old means) then halt else means_are_changing = 1 end
Comments on the K-means algorithm • Time Complexity • per iteration = Nd + Kd = O(Nd) • Can show that TSE decreases (or converges) at each iteration • Does it find the global minimum of TSE? • No, not necessarily • in a sense it is doing “steepest descent” from a random initial starting point • thus, results will be sensitive to the starting point • in practice, we can run it from multiple starting points and pick the solution with the lowest TSE (the most “compact” solution)
Clustering Pixels in an Image • We can use K-means to cluster pixel intensities in an image into K clusters • this provides a simple way to “segment” an image into K regions of similar “compact” image intensities • more automated than manual thresholding of an image • How to do this? • Size(image pixel matrix) = m x n • convert to a vector with (m x n) rows and 1 column • this is a 1-dimensional feature vector of pixel intensities • run the k-means algorithm with input = vector of intensities • assign each pixel the “color or grayscale” of the cluster it is assigned to
Clustering Images • We can also cluster sets of images into groups • now each vector = a full image (dimensions 1 x (mxn)) • N images of size m x n • convert to a matrix with N rows and (m x n) columns • just use image_to_matrix.m • call kmeans with D = this matrix • kmeans is now clustering in an (m x n) dimensional space • kmeans will group the images into K groups
Example: First 5 Individuals, K = 2 Cluster 1 Cluster 2
Example: 2nd 5 individuals, K = 2 Cluster 1 Cluster 2
Assignment • Finish the kmean function following the pseudocode • Additional feature: plot the data and mark points belonging to different clusters with different colors • Debug clusterimage function and test it using image files
Summary • Clustering • automated methods to assign feature vectors to K clusters • K-means algorithm • how to use K-means to segment pixel intensities into K groups