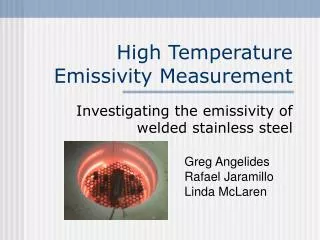
High Temperature Emissivity Measurement
330 likes | 1.18k Views
High Temperature Emissivity Measurement. Investigating the emissivity of welded stainless steel Greg Angelides Rafael Jaramillo Linda McLaren. Presentation Overview. Importance of knowing high-temp emissivity Theoretical background Experimental Setup Results

High Temperature Emissivity Measurement
E N D
Presentation Transcript
High Temperature Emissivity Measurement Investigating the emissivity of welded stainless steel Greg AngelidesRafael Jaramillo Linda McLaren
Presentation Overview • Importance of knowing high-temp emissivity • Theoretical background • Experimental Setup • Results • Discussion of results and errors • Suggestions for future work
Emissivity and Welding • Ability to control temp. around weld • HEF is crucial to weld properties • Emissivity figures in heat equations
Variable Emissivity • Carbonization of metal surface, due to heat of welding process changes e • Change in metal temperature changes e We will attempt to make a model which can predict changes in emissivity due to varying temperature and surface conditions
Carbonization in samples sample 1 sample 2 sample 3 sample 4 sample 5
Theory:Stefan-Boltzmann Equation • Q = es(Tsample4 - Tsurrounding4) • Q - heat radiated e -emissivity • s - Stefan-Boltzmann constant
Experimental Overview • In order to calculate e, we design an experiment to measure all other variables in the Stefan-Boltzmann equation: • T of sample • T of surroundings • Q radiated
Initial Experiment: Cold Temperature Emissivity • To test of our theory and equipment, we first conducted an experiment around room temperature (samples heated to ~40 oC)
Experimental Setup hot plate sample IR camera
Data Acquisition • IR camera image is recorded on VHS and analyzed on computer • Pixel level is easily converted into emission level Example of infrared image
Emittance Measurement Trick • IR camera does not measure real Q • Gives relative, unitless emission levels • We use the following equation to convert emission levels to emittance: (target lvl.) – (background lvl.) (reference lvl.) – (background lvl.) e = * (reference e)
Reference Emittance Value • Must calculate a reference emittance value for some point on the sample • Need the actual temp. of a point, as well as the IR camera’s indicated temp. • IR camera emittance set to unity eIRs ( Tcamera4 –Tsurrounding4) = eactuals (Tactual4 – Tsurrounding4) desired value
High Temperature Experiment • Must modify experimental setup to accommodate temperatures up to 450 oC • Data is taken every 50 oC, from 50 oC to 450 oC • In addition to testing our five welded samples, we will now test a clean, unwelded sample.
Analysis of Results • Attempt to fit data to following mathematical model: etotal = einitial * T(temp) * C(color)
Isolating the Temperature Dependence etotal = einitial * C(color) * T(temp) ecold = einitial * C(color) etotal T(temp) = ecold
Isolating the Effect of Weld-Produced Color Bands etotal = einitial * T(temp) * C(color) ereference = einitial * T(temp) etotal = C(color) ereference
Using C(color) and T(temp) • With accurate graphs of the functions C(color) and T(temp), one could calculate the emissivity etotal with the following equation: etotal = einitial * T(temp) * C(color)
Sources of Error • Camera placement • Heating of camera – condensation on lens • Inconsistent surrounding temperature • Direct thermocouple measurements – insufficient contact with samples
Sources of Error • Further carbonization of samples: before heating after heating
Suggestion for Future Work • Create a more uniform environment • Isolate camera from heat • Improve camera resolution • Weld thermocouple leads to samples • Account for further carbonization