Download
1 / 30
300 likes | 493 Views
Geophysical Applications Mine Waste Piles. Bruce D. Smith, USGS bsmith@usgs.gov GSA Workshop Characterization and Toxicity Assessment of Mine-Waste Sites November 13, 2004 Denver, Colorado. U.S. Department of the Interior U.S. Geological Survey.

E N D
Geophysical ApplicationsMine Waste Piles Bruce D. Smith, USGS bsmith@usgs.gov GSA Workshop Characterization and Toxicity Assessment of Mine-Waste Sites November 13, 2004 Denver, Colorado U.S. Department of the Interior U.S. Geological Survey
Flow Chart for Ranking and Prioritization (Geophysics) Site Geophysics Physical Prop Borehole Ground surveys Detailed Characterization Geophysical & Remote Sensing Methods Reconnaissance Regulatory Watershed Geophysics Ground Airborne Satellite -ASTM standards for some methods -Licensing issue in some states Scale Microscopic Site Watershed Regional
Why Geophysics???? • Non invasive (usually) • Rapid surface and subsurface mapping information • Money: Survey costs can be high but savings can be great • Airborne no access problems (PRP issues) and large areas
What’s the Objective • Physical property mapping (conductivity for example) • Trends and hot spots (anomalies) • Analysis of subsurface (below the obvious)
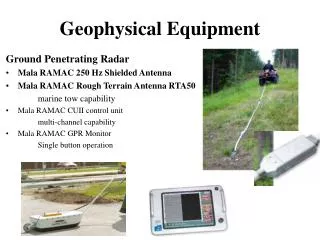
Geophysical Methods • Remote Sensing • Satellite • High Altitude Multispectral (U2, Fixed wing) • Airborne • Electromagnetic (induction) • Magnetic • Radiometric • Ground (as above and ) • Ground Penetrating Radar • Seismic • Gravity • DC Resistivity • Induced Polarization
Remote Sensing • Linear feature mapping using a variety of satellite data such as LandSat and Thematic mapper • Mapping areas of alteration (limonite mapping) – Thematic Mapper and Landsat • Surface mineral and chemical mapping high and low altitude AVIRIS
NOTES FOR REMOTE SENSING SLIDES The Basin Mining District was one site for integrated studies of abandoned mine lands published in the following Professional Paper: Nimick, D.A., Church, S.E., and Finger, S.E., eds., in press (2003), Integrated investigations of environmental effects of historical mining in the Basin and Boulder Mining Districts, Boulder River Watershed, Jefferson County, Montana: U.S. Geological Survey Professional Paper 1652. (Will be available online at http://pubs.usgs.gov/products/books/profpaper.html) The linear features slide shows the area of the Luttrell Pit which at the time of the USGS study was being considered for a mine waste repository. The remote sensing study of the area included an interpretation and analysis of linear features that cross the proposed repository. No such feature was found even though there are numerous structures in the general area. The remote sensing study results were integrated with other studies as discussed in the above reference. An example of AVIRIS (Airborne Visible/Infrared Imaging Spectrometer; http://aviris.jpl.nasa.gov) is shown on the two slides from the Leadville, CO, mining district study. Papers on the studies from this site can be found at: http://speclab.cr.usgs.gov. The slides show how the data can be used to identify mineral types in mine waste areas. The close-up shows the high resolution of the data and interpretation in comparison to ground sampling. The mineral maps have helped officials save roughly $500,000 and about a year's time in identifying the areas that need attention.
Linear Feature Mapping Boulder Watershed, MT • Four data sets were used as base images for linear feature mapping Landsat Thematic Mapper (TM) India Remote Sensing (IRS) satellite data Digital Orthophoto Quads (DOQ) USGS Digital Elevation Model (DEM)
Luttrell Pit Repository Area REPOSITORY
Imaging Spectroscopy (AVIRIS) 6 Leachate pH 2
Airborne Geophysical Surveys • Radiometrics • - radioactive decay products • Total field magnetics • - Magnetization • Electromagnetics • -electrical conductivity
NOTES FOR AIRBORNE MAGNETICS Airborne magnetic and electromagnetic surveys were conducted as a part of the Basin and Boulder Mining District investigations referenced previously. Slide A shows the total magnetic field map processed to show shallow magnetic sources. There are many linear trends that are associated with structures and lithologic contacts that were not shown in geological mapping of the quadrangles. One important linear feature is just south of the Luttrell repository (see previous linear feature discussion) and could be a control for bedrock ground water flow. There were several monitoring wells put in south of the repository partly based on the geophysical interpretation. An important conclusion from the airborne surveys were that the data could be used to predict areas of acid water neutralization (see McCafferty and others, Prof Paper 1625). The acid neutralization was found to be associated with a mafic mineral assemblage that included magnetite (slide B). Slide C shows acid neutralizing potential from geological and geophysical maps. Such maps show the vulnerability of the landscape for location of repositories and area of possible high acid water generation.
Magnetics Example from Boulder Watershed A Repository
ANP minerals with magnetite Associated Magnetite B
C Model for acid neutralizing
Geoelectrical Methods • CONTACTING • DC (direct current resistivity) • IP (induced polarization) • INDUCTION • FEM (frequency domain electromagnetics) • TEM (time domain electromagnetics) • CSAMT (CS audiomagnetotellurics) • NATURAL FIELDS • SP (spontaneous polarization or self potential) • AMT/MT (magnetutellurics)
NOTES FOR CONDUCTIVITY SURVEYS The Fey chart (slide A) shows that high conductivities are associated with more acid waters. The conductivity of pore-filling waters is one major factor that controls the electrical response from ground and airborne electrical surveys. In many mining districts alteration produced clays and massive metallic minerals are sources of high conductivities. Slide B is from: Morris, B., Shang, J., Howarth, P., and Witherly K. (2002, Application of Remote Sensing and Airborne Geophysics to Mine Tailings Monitoring, Copper Cliff, Ontario: Proceedings for the Symposium on the Application of Geophysics to Environmental and Engineering Problems, Las Vegas, 14p). This is a good example of both airborne hyperspectral imaging shown in a map view panel on the bottom and a helicopter borne survey used to produce the conductivity depth image (CDI) in cross-section (upper panel). The CDI provides subsurface information not seen in the surface reflectance data. Red (light areas in gray scale) shows area of high subsurface conductivity that are associated with acid waters. Slide C, an example from the eastern US coal mines, is adapted from results of a program carried out by the Department of Energy National Energy Technology Lab (NETL) and described in a special issue of Mine Water and the Environment (2003, T.E. Ackman ed. Special Issue on Airborne Remote Sensing, vol. 22, no. 2). Light area in the CDI cross section show areas of high conductivity mine waters and areas of acid generating mine waste that possibly are sources of infiltration to the ground water.
A Fey chart
Conductivity Depth Section B Conductivity depth section from Helicopter EM survey along line shown in the bottom plan view map from airborne hyperspectral survey
C Pennsylvania Coal Mine example
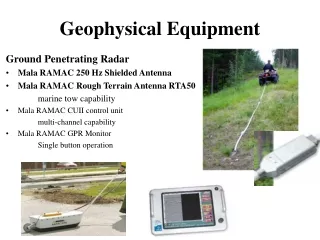
NOTES FOR CONDUCTIVITY SURVEYS (cont) Slide A shows one of several different types of terrain conductivity geophysical instruments that can be used to map very shallow (few meters as is the case for this system) to deep (10s of meters). This system was used to map shallow subsurface contamination at the Buckeye Meadows site (slide B) as part of the Basin and Boulder Mining District studies discussed previously. (McDougal, R.R., and Smith, B.D., 2000) Slide C shows an areal photograph of the site where lighter areas are high reflectance areas and circles show sites of shallow hand cores and ground water sampling wells (BM). An apparent conductivity map is shown in slide D where the high conductivities shown in the warmer colors (lighter). The ground survey shows the plume of high TDS waters in much more detail than the limited bore hole sampling. The plume has no surface expression other than the tailings area. The ground geophysical anomalies were confirmed by shallow drilling. The tailings were dug up and moved to the Luttrell repository discussed previously. Borehole logging provides important supplemental information to ground subsurface mapping surveys. An example from a geoprobe electrical resistivity measurement is shown in slides E and F. The geoprobe resistivity depth profile (slide F) shows the correlation of subsurface logging and surface geophysical surveys. The study area is located in Oklahoma in a mine waste study of a residential area. (POST REMEDIATION CHARACTERIZATION OF LNAPL USING DIRECT PUSH ELECTRICAL RESISTIVITY TOMOGRAPHY GRAHAM, Ivy, HALIHAN, Todd, PAXTON, Stanley T., and RILEY, Matthew, School of Geology, Oklahoma State Univ, 105 Noble Research Center, Stillwater, OK 74078; GSA abstract, 2003 annual meeting) In general both induction conductivity and resistivity borehole measurements can provide information about ground water electrical properties both in the vadose zone and below the water table.
A Geonics EM-31 One of several different types of terrain conductivity systems
Buckeye tailings B Buckeye Separator Tailings, Boulder Mining District, MT
D EM31 conductivity map VMD 3m
GEOPROBE SHALLOW PENETROMETER E GEOPROBE SHALLOW PENETROMETER (University of Oklahoma)
Other GP Methods • Seismic Reflection and Refraction velocity contrasts needed • Ground Penetrating Radar need very resistive ground but generally not deep (few feet)
Geophysics TRY IT! • Cost effective for subsurface mapping at site and watershed scale (note: no access issue in airborne) • Integration with geology and geochemistry…NOT a black box universal solution • Avoid “nothing else works … try geophysics” …design application to physical property • Match the method to the site and problem…do not use EM under power lines
SELECTED REFERENCES Open-file Report 03-210 Determining the Toxicity Potential of Mine-Waste Piles http://pubs.usgs.gov/of/2003/ofr-03-210/ Campbell, D.L., 2000, Annotated bibliography of geophysical methods for characterizing mine waste, late-1994 through early 2000: U.S. Geological Survey Open-File Report 00-428, which can be accessed at: http://crustal.usgs.gov/minewaste/geophysics_mine_pubs.html (Accessed June 2000) McDougal, R.R., and Smith, B.D., 2000, Ground geophysical study of the Buckeye Mine tailings, Boulder watershed, Montana, U.S. Geological Survey Open-File Report 00-0371, 55p. GENERAL GEOPHYSICS SURVEYS AND PRINCIPLES Sharma, P.Y., 1997 (reprinted 2002), Environmental and engineering geophysics, Cambridge University Press, Cambridge, England, 508p. Kearey, P., Brooks, M., and Hill, I, 2002, An introduction to geophysical exploration, Blackwell Science.