Download
1 / 21
210 likes | 230 Views
Explore the impact of industrial air pollution plumes and the scavenging of pollutants by cloud and rain droplets. Learn about key substances emitted and the Gaussian plume model for studying dispersion. Discover the importance of air quality modeling in environmental assessment.

E N D
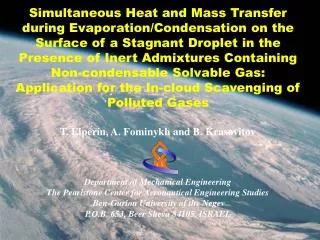
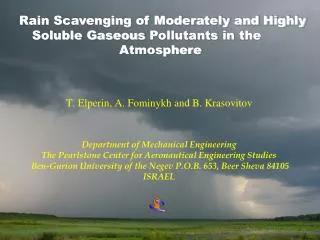
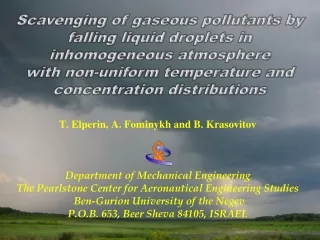
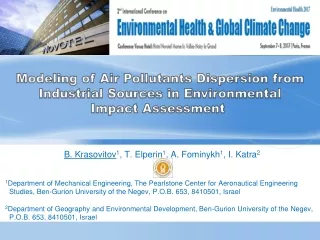
Modeling of Air Pollutants Dispersion from Industrial Sources in Environmental Impact Assessment B. Krasovitov1, T. Elperin1, A. Fominykh1, I. Katra2 1Department of Mechanical Engineering, The Pearlstone Center for Aeronautical Engineering Studies, Ben-Gurion University of the Negev, P.O.B. 653, 8410501, Israel 2Department of Geography and Environmental Development, Ben-Gurion University of the Negev, P.O.B. 653, 8410501, Israel
Industrial air pollution plumes Scavenging of air pollutions by cloud and rain droplets Scavenging of air pollutions by cloud and rain droplets Ne'ot Hovav chemical factory (Nothern Negev, Israel) Power plant (Ashquelon, Israel)
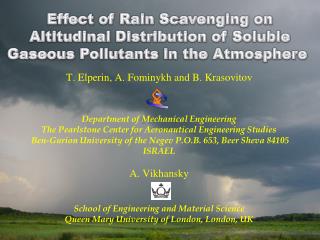
Industrial air pollution plumes Heating plant (Hanover, NH US) Scavenging of air pollutions by cloud and rain droplets
Industrial air pollution plumes • Substances emitted into the atmosphere • from industrial sources include: • Carbon dioxide (CO2) • Carbon monoxide (CO) • Sulfur oxides (SOx) • Nitrogen oxides (NOx) • Volatile organic compounds (VOC) • Carbon-based particulate matter (PM2.5-10)
Air pollution monitoring Beer-Sheva, Northern Negev AQI
Air pollution monitoring Table of breakpoints (according to US Environmental Protection Agency standards)
Gaussian plume model Scavenging of air pollutions by cloud and rain droplets Gaussian Plume model
Gaussian plume model Pasquill-Gifford stability categories
Gaussian plume model Pasquill-Gifford horizontal dispersion parameters
Gaussian plume model Pasquill-Gifford vertical dispersion parameters
Gaussian plume model Fig. 4. Concentration distributions in the XZ-plane, evaluated at Y=0.
Measurements of mean wind velocity profile Fig. 6. A cup anemometer Katra et al., Aeolian Research 20 (2016) 147–156 Fig. 5. A 10-m wind mast
Measurements of mean wind velocity profile For each height the average wind velocity was calculated as follows
Adsorption of trace atmospheric gases by plume Scavenging of air pollutions by cloud and rain droplets Fig. 7. Concentration distributions in the XZ-plane, evaluated at Y=0 (Elperin et al., Process Saf. Environ. Prot., 111 (2017) 375–387).
Adsorption of trace atmospheric gases by plume Scavenging of air pollutions by cloud and rain droplets Fig. 8. Concentration profiles of HNO3 in the atmosphere calculated in the XZ-plane at Y = 0 (speed of wind at the height of release – 6.36 m/s; height of release – 20 m; rate of release – 10 g/s ). Fig. 9. Ground level concentration of HNO3 vs. distance from the point of release.
Wet deposition of PM emission Fig. 4. Concentration distribution in the XZ-plane, evaluated at Y=0 (Elperin et al., Process Saf. Environ. Prot., 102 (2016) 303-315). Scavenging of air pollutions by cloud and rain droplets
Conclusions Scavenging of air pollutions by cloud and rain droplets • The air quality modelling (AQM) is one of the principal approaches to air pollution exposure assessment. • Air quality study implies the estimation of some pollutants concentration in a region of interest, during a finite period of time. • The characteristics of each specific problem will define the physical and chemical processes involved, and consequently, the best model to use. • Mathematical models integrate our knowledge of the chemical and physical processes of pollutant dynamics into a structured framework that can be used to explain the relationship between sources of air pollution and the resulting impact on human health.
Acknowledgements Scavenging of air pollutions by cloud and rain droplets This work was partially supported by Israel Science Foundation governed by the Israeli Academy of Sciences (Grant No. 1210/15) and by Israel Ministry of National Infrastructures, Energy and Water Resources.


![C[ i ][j]=A[ i ][1]+B[1][j]](https://cdn2.slideserve.com/3988576/slide1-dt.jpg)