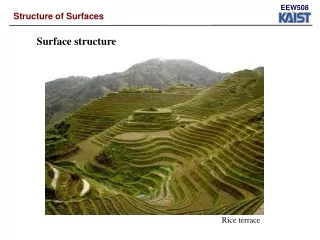
EEW508
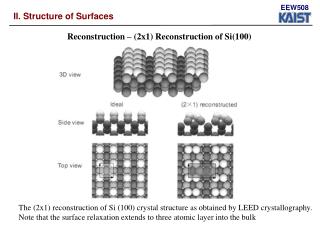
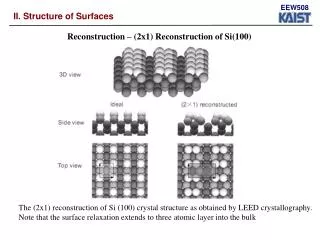
EEW508. II. Structure of Surfaces. Reconstruction – (2x1) Reconstruction of Si(100). The (2x1) reconstruction of Si (100) crystal structure as obtained by LEED crystallography. Note that the surface relaxation extends to three atomic layer into the bulk. EEW508. II. Structure of Surfaces.

EEW508
E N D
Presentation Transcript
EEW508 II. Structure of Surfaces Reconstruction – (2x1) Reconstruction of Si(100) The (2x1) reconstruction of Si (100) crystal structure as obtained by LEED crystallography. Note that the surface relaxation extends to three atomic layer into the bulk
EEW508 II. Structure of Surfaces (7x7) Reconstruction of Si (111) DAS structure: dimer, adatom, and stacking fault LEED and STM image of (7x7) reconstructed structure of Si (111) The total number of dangling bonds is reduced from 49 to 19 through this reconstruction.
EEW508 II. Structure of Surfaces (7x7) Reconstruction of Si (111) 19 dangling bonds of (7x7) reconstructed surface (12 adatom, 6 rest atom, 1 corner hole)
EEW508 II. Structure of Surfaces Reconstruction on metallic surface – Ir(100) (5x1) reconstruction Bulk structure:the square lattice Surface structure: hexagonally close packed layer
EEW508 II. Structure of Surfaces Reconstruction on metallic surface –Ir (110) missing dimer row (2x1) reconstruction structure
EEW508 II. Structure of Surfaces Reconstruction – Ionic crystal Ionic crystal consists of charged spheres stacked in a lattice.
EEW508 II. Structure of Surfaces Surfaces with strong chemical bonds exhibits more drastic rearrangement of surface atoms Generally speaking, surfaces with weak chemical bonds (van der Waals, hydrogen, dipole-dipole and ion-dipole) exhibits less pronounced reconstructed structure -- for example, Graphite (0001) surface
EEW508 II. Structure of Surfaces Reconstruction of high-Miller-index surfaces Reconstruction at Cu(410) stepped surface. Atoms in the first row at the each step become adatoms which are pointed out in the side view of the reconstructed surface. Roughening transition: If the surface is heated near the melting temperature, the steps become curved and break up into small islands
EEW508 III. Molecular and Atomic Process on Surfaces Structure of ordered monolayer When atoms or molecules adsorb on ordered crystal surface, they usually form ordered surface structure over a wide range of temperature and surface coverages. Two factors which decide the surface ordering of adsorbates are Adsorbate-adsorbate(AA) interaction and adsorbate-substrate(AS) interaction Chemisorption – adsorbate-substrate interaction is stronger than adsorbate-adsorbate interaction, so the adsorbate locations are determined by the optimum adsorbate-substrate bonding, while adsorbate-adsorbate interaction decides the long-range ordering of the overlayer. Physisorption or physical adsorption – AA interaction dominates the AS interaction –the surface could exhibit incommensurate structures.
EEW508 III. Molecular and Atomic Process on Surfaces Coverage of adsorbate molecules “Introduction to Surface Chemistry and Catalysis” G. A. Somorjai and Y. Li Definition of coverage: one monolayer corresponds to one adsorbate atom or molecules for each unit cell of the clean, unreconstructed substrate surface. For example, the surface coverage of atom on fcc(100) is one-half a monolayer.
EEW508 III. Molecular and Atomic Process on Surfaces Ordering of adsorbate molecules “Introduction to Surface Chemistry and Catalysis” G. A. Somorjai and Y. Li Atomic oxygen on Ni (100) Up to one quarter of the coverage: Ni(100)-(2x2)-O Between one quarter and one half Ni(100)-c(2x2)-O
EEW508 III. Molecular and Atomic Process on Surfaces Epitaxial Growth With metallic adsorbates, very close packed overlayers can form because of attractive force among adsorbed metal atoms. When the atomic sizes of the overlayer and substrate metals are nearly the same, we can observe a one-monolayer (1x1) surface. This is called epitaxial growth.
EEW508 III. Molecular and Atomic Process on Surfaces Adsorbate-induced reconstructuring
EEW508 III. Molecular and Atomic Process on Surfaces Adsorbate induced restructuring – Ni (100) – c(2x2) - C “Introduction to Surface Chemistry and Catalysis” G. A. Somorjai and Y. Li Carbon chemisorption induced restructuring of the Ni (100) surface. Four Ni atoms surrounding each carbon atom rotate to form reconstructed substrate.
EEW508 III. Molecular and Atomic Process on Surfaces Adsorbate induced restructuring – Fe (110) – (2x2)-S “Introduction to Surface Chemistry and Catalysis” G. A. Somorjai and Y. Li S-Fe (110), Sulfur-chemisorption-induced restructuring of the Fe(110) surface.
EEW508 III. Molecular and Atomic Process on Surfaces Adsorbate induced restructuring of steps to multiple-height step – terrace configuration
EEW508 III. Molecular and Atomic Process on Surfaces Sulfur-chemisorption-induced restructuring of the Ir (110) surface “Introduction to Surface Chemistry and Catalysis” G. A. Somorjai and Y. Li fcc(111) surface restructure more frequently upon chemisorption than do the closer-packed crystal faces.
EEW508 III. Molecular and Atomic Process on Surfaces Penetration of atoms through or below the first layer “Introduction to Surface Chemistry and Catalysis” G. A. Somorjai and Y. Li
EEW508 III. Molecular and Atomic Process on Surfaces Growth modes of metal surfaces
EEW508 III. Molecular and Atomic Process on Surfaces Growth modes of metal surfaces Auger signal of substrate Auger signal of adsorbate
EEW508 III. Molecular and Atomic Process on Surfaces Adsorption of CO on transition metal CO is found to adsorb dissociatively on the early transition metals (to the left of the periodic table) and molecularly on the late transition.
EEW508 III. Molecular and Atomic Process on Surfaces Adsorption of CO on transition metal The preferred adsorption site of CO depends on three factors: The metal, the crystallographic face, and the CO coverage Ni (111) face: CO occupies the bridge sites first Rh(111), Pt(111) the top sites are preferred at low coverages. The threefold site is occupied first on Pd(111).
EEW508 III. Molecular and Atomic Process on Surfaces Adsorption of Ethylene on metal Unsaturated hydrocarbon adsorption on clean transition metal is that it is mainly irreversible. Once unsaturated hydrocarbon molecules are adsorbed on the surface, if the surface is heated, Then the adsorbed molecules will decompose to evolve hydrogen and leave the surface covered with the partially dehydrogenated fragments or carbon.
EEW508 III. Molecular and Atomic Process on Surfaces Desorption of Ethylene on metal Thermal desorption of hydrogen from chemisorbed ethylene on Rh(111) due to thermal dehydrogenation for several coverages. To determine the structure and bonding of these various surface fragments, vibration spectroscopy or HREELS over a temperature range can be used.
EEW508 III. Molecular and Atomic Process on Surfaces Case study – graphene on Pt(111) surface The clean surface was then exposed to ethylene at room temperature by backfilling the chamber with ethylene. Exposures were typically greater than 10 Langmuir to ensure saturationof the Pt(111) surface. After exposure, the sample was heated to about 1250 K, resulting in the decomposition of ethylene and formation of a single monolayer of graphite on the Pt(111) surface. M. Enachescu et al. Phys. Rev. B. 60 16913 (1999). AFM image of moiré superstructure. Image size is 10 nm310 nm.
EEW508 III. Molecular and Atomic Process on Surfaces Adsorption of ethylene on Rh(111) and Pt(111) • Vibrational spectra from chemisorbed ethylene on Rh(111) at different temperature obtained by HREELS. • SFG (Sum frequency generation) spectroscopy revealing di- bonded ethylene at 202 K on Pt(111), • ethylidyne at 300K on Pt(111).
EEW508 III. Molecular and Atomic Process on Surfaces Formation of ethylidyne (CCH3 at high temperature (> 220K) Bonding geometry of ethylidyne on the Rh(111) and Pt(111) crystal surface.
EEW508 III. Molecular and Atomic Process on Surfaces Ethylidyne-chemisorption-induced restructuring of the Rh(111) surface Metal-metal distances expand for those Rh atoms that bind to the carbon of the ethylidyne molecule located in the three fold site. Rh atoms in the second layer moves also upwards, closer to the organic molecules.
EEW508 III. Molecular and Atomic Process on Surfaces SFG (Sum-frequency generation) vibrational spectroscopy Physics Today, Somorjai and Park, Oct (2007)
EEW508 III. Molecular and Atomic Process on Surfaces Schematic of SFG (Sum-frequency generation) vibrational spectroscopy system
EEW508 III. Molecular and Atomic Process on Surfaces Detection of reaction intermediates on Pt(111) with SFG SFG spectrum of the Pt(111) surface during ethylene hydrogenation The spectrum was measured with 100 Torr of H2, 35 Torr of C2H4, and 615 Torr of He at 295 K
EEW508 III. Molecular and Atomic Process on Surfaces High pressure STM and surface mobility – ethylene on Pt(111) (100 x 100) Å2 STM images of the Pt(111) surface under different pressures: (a) 20 mtorr H2, (b) 20 mtorr H2 and 20 mtorr ethylene, and (c) 20 mtorr H2, 20 mtorr ethylene, and 2.5 mtorr CO. The presence of CO induced the formation of a (19 x 19) R23.4° structure on the surface. (d) (200 200) Å2 STM image showing two rotational domains of (19 19)R23.4°.
EEW508 III. Molecular and Atomic Process on Surfaces High pressure STM and surface mobility – ethylene on Rh(111) (100 x 100) Å2 STM images of the Rh(111) surface under pressures of (a) 20 mtorr H2 and (b) 20 mtorr H2 and 20 mtorr ethylene. (c) (50 50) Å2 STM image of c(4 2)-CO + C2H3 structure formed at 20 mtorr H2, 20 mtorr ethylene, and 5.6 mtorr CO, and (d) a schematic showing the proposed
EEW508 III. Molecular and Atomic Process on Surfaces Reactivity of ethylene hydrogenation – with and without CO Turnover rate during ethylene hydrogenation on Pt(111)
EEW508 III. Molecular and Atomic Process on Surfaces Detection of reaction intermediates on Pt nanoparticles with SFG In situ monitoring of nanoparticles by high-pressure SFG spectroscopy. NP: nanoparticle
EEW508 III. Molecular and Atomic Process on Surfaces UV/Ozone cleaning removes the organic capping layers of nanoparticles TEM images of a Langmuir-Blodgett film of 10 nm platinum cubes (a) before and (b) after 2 h of UV-ozone treatment Aliaga et al. J. Phys. Chem. C, 2009, 113 (15), 6150-6155
EEW508 III. Molecular and Atomic Process on Surfaces UV/Ozone cleaning removes the organic capping layers of nanoparticles SFGVS spectra of a Langmuir-Blodgett film of 10 nm TTAB-capped platinum cubes.
EEW508 III. Molecular and Atomic Process on Surfaces Detection of reaction intermediates on Pt NP with SFG Aliaga et al. J. Phys. Chem. C, 2009, 113 (15), 6150-6155 SFG spectra of a drop-cast film of a 10 nm TTAB-capped platinum cube under ethylene hydrogenation conditions. The spectrum shows contributions from ethylidine and di-σ-bonded ethylene adsorbates. A very small contribution from the intermediate π-bonded species is also visible at 760 Torr and 298 K.
EEW508 Molecular and Atomic Process on Surfaces
EEW508 III. Molecular and Atomic Process on Surfaces Surface structure of alloy, AlCu “Introduction to Surface Chemistry and Catalysis” G. A. Somorjai and Y. Li Cu84Al16 alloy (111) structure exhibiting 3 x 3 R30o The surface composition is 50%