Chapter 23
Chapter 23. The Evolution of Populations. Overview: The Smallest Unit of Evolution. One misconception is that organisms evolve, in the Darwinian sense, during their lifetimes Natural selection acts on individuals, but only populations evolve

Chapter 23
E N D
Presentation Transcript
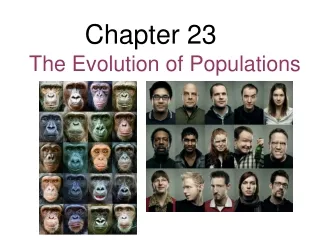
Chapter 23 The Evolution of Populations
Overview: The Smallest Unit of Evolution • One misconception is that organisms evolve, in the Darwinian sense, during their lifetimes • Natural selection acts on individuals, but only populations evolve • Genetic variations in populations contribute to evolution • Microevolution is a change in allele frequencies in a population over generations
Concept 23.1: Mutation and sexual reproduction produce the genetic variation that makes evolution possible • Two processes, mutation and sexual reproduction, produce the variation in gene pools that contributes to differences among individuals
Genetic Variation • Variation in individual genotype leads to variation in individual phenotype • Not all phenotypic variation is heritable • Natural selection can only act on variation with a genetic component
Fig. 23-2a (a)
Fig. 23-2b (b)
Variation Within a Population • Both discrete and quantitative characters contribute to variation within a population • Discrete characters can be classified on an either-or basis • Quantitative characters vary along a continuum within a population
Population geneticists measure polymorphisms in a population by determining the amount of heterozygosity at the gene and molecular levels • Average heterozygosity measures the average percent of loci that are heterozygous in a population • Nucleotide variability is measured by comparing the DNA sequences of pairs of individuals
Variation Between Populations • Most species exhibit geographic variation,differences between gene pools of separate populations or population subgroups
Fig. 23-3 1 3.14 5.18 2.4 6 7.15 8.11 9.12 10.16 13.17 19 XX 6.7 1 2.19 3.8 4.16 5.14 9.10 11.12 13.17 15.18 XX
Some examples of geographic variation occur as a cline, which is a graded change in a trait along a geographic axis
Fig. 23-4 1.0 0.8 0.6 Ldh-Bb allele frequency 0.4 0.2 0 44 42 40 34 46 38 36 32 30 Latitude (°N) Maine Cold (6°C) Georgia Warm (21°C)
Mutation • Mutations are changes in the nucleotide sequence of DNA • Mutations cause new genes and alleles to arise • Only mutations in cells that produce gametes can be passed to offspring Animation: Genetic Variation from Sexual Recombination
Point Mutations • A point mutation is a change in one base in a gene
The effects of point mutations can vary: • Mutations in noncoding regions of DNA are often harmless • Mutations in a gene might not affect protein production because of redundancy in the genetic code
The effects of point mutations can vary: • Mutations that result in a change in protein production are often harmful • Mutations that result in a change in protein production can sometimes increase the fit between organism and environment
Mutations That Alter Gene Number or Sequence • Chromosomal mutations that delete, disrupt, or rearrange many loci are typically harmful • Duplication of large chromosome segments is usually harmful • Duplication of small pieces of DNA is sometimes less harmful and increases the genome size • Duplicated genes can take on new functions by further mutation
Mutation Rates • Mutation rates are low in animals and plants • The average is about one mutation in every 100,000 genes per generation • Mutations rates are often lower in prokaryotes and higher in viruses
Sexual Reproduction • Sexual reproduction can shuffle existing alleles into new combinations • In organisms that reproduce sexually, recombination of alleles is more important than mutation in producing the genetic differences that make adaptation possible
Concept 23.2: The Hardy-Weinberg equation can be used to test whether a population is evolving • The first step in testing whether evolution is occurring in a population is to clarify what we mean by a population
Gene Pools and Allele Frequencies • A population is a localized group of individuals capable of interbreeding and producing fertile offspring • A gene pool consists of all the alleles for all loci in a population • A locus is fixed if all individuals in a population are homozygous for the same allele
Fig. 23-5 Porcupine herd MAP AREA CANADA ALASKA Beaufort Sea NORTHWEST TERRITORIES Porcupine herd range Fortymile herd range YUKON ALASKA Fortymile herd
Fig. 23-5a MAP AREA CANADA ALASKA Beaufort Sea NORTHWEST TERRITORIES Porcupine herd range Fortymile herd range YUKON ALASKA
The frequency of an allele in a population can be calculated • For diploid organisms, the total number of alleles at a locus is the total number of individuals x 2 • The total number of dominant alleles at a locus is 2 alleles for each homozygous dominant individual plus 1 allele for each heterozygous individual; the same logic applies for recessive alleles
By convention, if there are 2 alleles at a locus, p and q are used to represent their frequencies • The frequency of all alleles in a population will add up to 1 • For example, p + q = 1
The Hardy-Weinberg Principle • The Hardy-Weinberg principle describes a population that is not evolving • If a population does not meet the criteria of the Hardy-Weinberg principle, it can be concluded that the population is evolving
Hardy-Weinberg Equilibrium • The Hardy-Weinberg principle states that frequencies of alleles and genotypes in a population remain constant from generation to generation • In a given population where gametes contribute to the next generation randomly, allele frequencies will not change • Mendelian inheritance preserves genetic variation in a population
Fig. 23-6 Alleles in the population Frequencies of alleles Gametes produced p = frequency of Each egg: Each sperm: CR allele = 0.8 q = frequency of 80% chance 80% chance 20% chance 20% chance CW allele = 0.2
Hardy-Weinberg equilibrium describes the constant frequency of alleles in such a gene pool • If p and q represent the relative frequencies of the only two possible alleles in a population at a particular locus, then • p2 + 2pq + q2 = 1 • where p2 and q2 represent the frequencies of the homozygous genotypes and 2pq represents the frequency of the heterozygous genotype
Fig. 23-7-1 80% CR(p = 0.8) 20% CW(q = 0.2) Sperm CW (20%) CR (80%) CR (80%) Eggs 16% (pq) CRCW 64% (p2) CRCR 4% (q2) CW CW 16% (qp) CRCW CW (20%)
Fig. 23-7-2 64% CRCR,32% CRCW, and4% CWCW Gametes of this generation: 64% CR+16% CR=80% CR = 0.8 = p 4% CW+16% CW=20% CW= 0.2 = q
Fig. 23-7-3 64% CRCR,32% CRCW, and4% CWCW Gametes of this generation: 64% CR+16% CR=80% CR = 0.8 = p 4% CW+16% CW=20% CW= 0.2 = q Genotypes in the next generation: 64% CRCR,32% CRCW, and4% CWCWplants
Fig. 23-7-4 20% CW(q = 0.2) 80% CR(p = 0.8) Sperm CW (20%) CR (80%) CR (80%) Eggs 16% (pq) CR CW 64% (p2) CR CR 4% (q2) CW CW 16% (qp) CR CW CW (20%) 64% CR CR,32% CR CW, and4% CW CW Gametes of this generation: 64% CR +16% CR= 80% CR = 0.8 = p 4% CW+16% CW=20% CW= 0.2 = q Genotypes in the next generation: 64% CR CR,32% CR CW, and4% CW CW plants
Conditions for Hardy-Weinberg Equilibrium • The Hardy-Weinberg theorem describes a hypothetical population • In real populations, allele and genotype frequencies do change over time
The five conditions for nonevolving populations are rarely met in nature: • No mutations • Random mating • No natural selection • Extremely large population size • No gene flow
Natural populations can evolve at some loci, while being in Hardy-Weinberg equilibrium at other loci
Applying the Hardy-Weinberg Principle • We can assume the locus that causes phenylketonuria (PKU) is in Hardy-Weinberg equilibrium given that: • The PKU gene mutation rate is low • Mate selection is random with respect to whether or not an individual is a carrier for the PKU allele
Natural selection can only act on rare homozygous individuals who do not follow dietary restrictions • The population is large • Migration has no effect as many other populations have similar allele frequencies
The occurrence of PKU is 1 per 10,000 births • q2 = 0.0001 • q = 0.01 • The frequency of normal alleles is • p = 1 – q = 1 – 0.01 = 0.99 • The frequency of carriers is • 2pq = 2 x 0.99 x 0.01 = 0.0198 • or approximately 2% of the U.S. population
Concept 23.3: Natural selection, genetic drift, and gene flow can alter allele frequencies in a population • Three major factors alter allele frequencies and bring about most evolutionary change: • Natural selection • Genetic drift • Gene flow
Natural Selection • Differential success in reproduction results in certain alleles being passed to the next generation in greater proportions
Genetic Drift • The smaller a sample, the greater the chance of deviation from a predicted result • Genetic drift describes how allele frequencies fluctuate unpredictably from one generation to the next • Genetic drift tends to reduce genetic variation through losses of alleles Animation: Causes of Evolutionary Change
Fig. 23-8-1 CR CR CR CR CR CW CR CR CW CW CR CW CR CR CR CW CR CR CR CW Generation 1 p (frequency of CR) = 0.7 q (frequency of CW) = 0.3
Fig. 23-8-2 CW CW CR CR CR CR CR CR CR CW CR CW CR CR CW CW CW CW CR CR CR CW CR CW CW CW CR CR CR CW CR CR CR CW CR CW CR CR CR CW Generation 1 Generation 2 p (frequency of CR) = 0.7 p = 0.5 q (frequency of CW) = 0.3 q = 0.5
Fig. 23-8-3 CW CW CR CR CR CR CR CR CR CR CR CW CR CW CR CR CR CR CR CR CR CR CR CR CW CW CW CW CR CR CR CW CR CR CR CR CR CW CR CR CW CW CR CR CR CW CR CR CR CR CR CR CR CW CR CW CR CR CR CW Generation 1 Generation 2 Generation 3 p (frequency of CR) = 0.7 p = 1.0 p = 0.5 q (frequency of CW) = 0.3 q = 0.0 q = 0.5
The Founder Effect • The founder effect occurs when a few individuals become isolated from a larger population • Allele frequencies in the small founder population can be different from those in the larger parent population
The Bottleneck Effect • The bottleneck effect is a sudden reduction in population size due to a change in the environment • The resulting gene pool may no longer be reflective of the original population’s gene pool • If the population remains small, it may be further affected by genetic drift
Fig. 23-9 Bottlenecking event Surviving population Original population
Understanding the bottleneck effect can increase understanding of how human activity affects other species