Download
1 / 19
190 likes | 335 Views
This project investigates the toxicity of various cryoprotectant chemicals, such as glycerol, using adherent endothelial cells. The study aims to understand how factors like cryoprotectant type, concentration, temperature, and exposure time affect cell viability. Employing fluorescent cell viability assays, including PrestoBlue, we measure cellular responses before and after exposure to cryoprotectants. Initial experiments reveal variability in data, prompting methodological revisions to improve accuracy. Future work focuses on optimizing cryoprotectant protocols for enhanced cell preservation in biomedical applications.

E N D
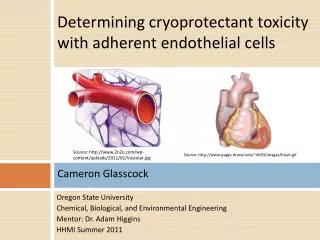
Determining cryoprotectant toxicity with adherent endothelial cells http://www.pages.drexel.edu/~nb93/images/heart.gif Source: http://www.2n2u.com/wp-content/uploads/2011/02/Vascular.jpg Source: http://www.pages.drexel.edu/~nb93/images/heart.gif Cameron Glasscock Oregon State University Chemical, Biological, and Environmental Engineering Mentor: Dr. Adam Higgins HHMI Summer 2011
Cryopreservation • Storage of biological materials • Tissue engineering, transplantation medicine, and other cell-based therapies • The problem: Ice crystal formation causes damage Source: http://en.wikipedia.org/wiki/File:Iceman_(Bobby_Drake).png
Cryoprotectant chemicals • Reduces damage caused by ice crystal formation • Vitrification • Addition and removal causes two types of damage • Osmotic damage • Toxicity damage Source: http://blog.bioethics.net/cryopreservation.jpg
Project • Goal: Determine toxicity of cryoprotectant chemicals with adherent endothelial cells. • Hypothesis: Cryoprotectant type, concentration, temperature, and exposure time have an effect on cryoprotectant toxicity Glycerol Source: http://www.benbest.com/cryonics/DMSO.jpg Source: http://www.bmrb.wisc.edu/metabolomics/standards/glycerol/lit/3416.png
Procedures • Endothelial cells seeded onto well plates • Exposure to cryoprotectant solutions Source http://www.porvair-sciences.com/acatalog/205003_1.jpg Source: http://us.123rf.com/400wm/400/400/phakimata/phakimata0806/phakimata080600061/3131934-blue-multi-channel-pipet-used-for-pipetting-a-96-well-plate-with-pink-solution-on-white.jpg
Procedures (Continued…) • Toxicity damage needs to be isolated from osmotic damage • Multi-step addition/removal during cryoprotectant exposure • Predict procedures with permeability and osmotic tolerance limits data Source: http://www.ccs.k12.in.us/chsteachers/amayhew/Biology%20Notes/transport%20notes.htm
Procedures (Continued…) • Toxicity measured using fluorescent cell viability assay PrestoBlue. • High fluorescence indicates more living cells Source: http://www.invitrogen.com/etc/medialib/en/images/ics_organized/applications/cell_tissue_analysis/popups.Par.16964.Image.-1.-1.1.gif
Procedures (Continued…) • PrestoBlue measurements taken twice • Directly before solution exposure to give initial seeding density fluorescence • 24 hours after solution exposure to give fluorescence after treatment • Accounts for apoptosis 3) Read fluorescence 2) Incubate PrestoBlue reagent 1) Add reagent to cells
Experimental Variables Propylene Glycol Ethylene Glycol DMSO Glycerol Cryoprotectant Type 3m 1m 5m 7m Concentration Exposure Time 60 min 40 min 20 min 10 min 5 min 0 min Temperature 21C 37C 4C
Data Analysis • Represented on cell survival versus time plot • Fit to exponential regression of the form:
Accounting for Multi-Step Add/Rem • Toxicity accumulated from lower concentrations • Accounted for with derived correction factor: 2-Step Add/Rem Procedure
Toxicity Function • The toxicity rate k is then plotted against concentration • Regression gives toxicity as a function of concentration • Mathematical representation of toxicity • Next step: Create a 3D regression to represent toxicity as a function of both concentration and temperature
Experimental Results • Initial Experiments • 1,3-molal Glycerol at 21C • Used 96-Well Plates • Results were highly variable • Possible Sources of Variability • Uneven seeding distribution • Cell loss during wash steps
Investigating Seeding Distribution • Uneven seeding distribution caused by thermal gradients • Pre-incubation to reduce variability • Involves placing well plates with freshly seeded cells at room temperature for 1 hour before placing in 37C incubator Pre-Incubated 1,3-Glycerol Toxicity Data
Investigating Cell Loss During Wash Steps • Experiment • Cells seeded onto 96-well plate • Wells were washed with a PBS buffer solution • PrestoBlue measurement taken after wash steps
Revised Experiments • 24-well plates • Avoid cell loss during wash steps • Increased well size helps to reduce variability
Experimental Conclusion • Initial experiments using 96-well plates yielded inconclusive data • Attempts to isolate cause of data variability • Seeding distribution • Cell loss due to wash steps • Experiment revised with some improvement using 24-well plates
Future Work • Improve experimental method • Try different cell viability assays • Optimization of cryoprotectant addition/removal for vitrification using: • Mathematical function for toxicity • Osmotic tolerance limits • Cell permeability data
Acknowledgements • HHMI • Kevin Ahern • Mentor: Dr. Adam Higgins • Allyson Fry • Ratih Lusianti • Kenneth Huang • Corey Lerch