Download
1 / 21
210 likes | 328 Views
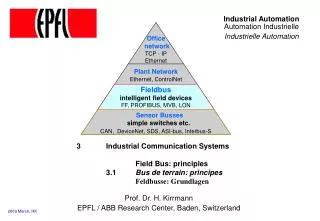
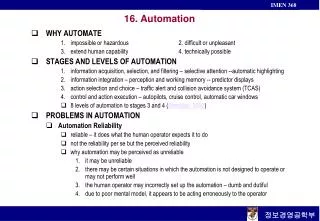
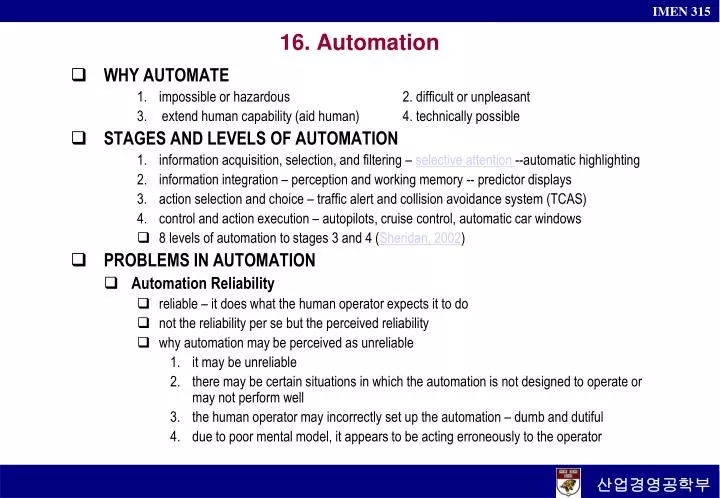
16. Automation. WHY AUTOMATE impossible or hazardous 2. difficult or unpleasant extend human capability (aid human) 4. technically possible STAGES AND LEVELS OF AUTOMATION information acquisition, selection, and filtering – selective attention --automatic highlighting

E N D
16. Automation • WHY AUTOMATE • impossible or hazardous 2. difficult or unpleasant • extend human capability (aid human) 4. technically possible • STAGES AND LEVELS OF AUTOMATION • information acquisition, selection, and filtering – selectiveattention --automatic highlighting • information integration – perception and working memory -- predictor displays • action selection and choice – traffic alert and collision avoidance system (TCAS) • control and action execution – autopilots, cruise control, automatic car windows • 8 levelsof automation to stages 3 and 4 (Sheridan, 2002) • PROBLEMS IN AUTOMATION • Automation Reliability • reliable – it does what the human operator expects it to do • not the reliability per se but the perceived reliability • why automation may be perceived as unreliable • it may be unreliable • there may be certain situations in which the automation is not designed to operate or may not perform well • the human operator may incorrectly set up the automation – dumb and dutiful • due to poor mental model, it appears to be acting erroneously to the operator
Trust: Calibration and Mistrust • trust should be well calibrated – trust should be in direct proportion to its reliability (mistrust) • Human trust in automation is not entirely well calibrated (distrust/overtust) • distrust is a type of mistrust where the person fails to trust the automation as much as is appropriate – are not necessarily severe, but may lead to inefficiency • Overtrust and Complacency • overtrust occurs when people trust the automation more than is warranted – severe negative consequences if the automation is less than fully reliable • The cause of complacency – human tendency to let experience guide our expectancies – perceived perfect reliability cease monitoring or far less frequently • Automation has three distinct implications for human intervention • detection: the complacent operator will likely be slower to detect a real failure; the more reliable, the rarer the signal events, and the poorer their detection • situation awareness – better aware with active participation (generation effect) – out of the loop, poor feedback of the automated process • skill loss (deskilling) – the gradual loss of skills • less self-confident in performance more likely to continue to use automation • degrade the operator’s ability to intervene approximately (fig 16.1) • Workload and Situation Awareness • as automation level moves up the scale, both workload and SA tend to go down • clumsy automation – automation makes easy tasks easier and hard tasks harder • Training and Certification
Loss of Human Cooperation • Job Satisfaction • FUNCTION ALLOCATION BETWEEN THE PERSON AND AUTOMATION • Fitts’s List (Table 16.2) • HUMAN-CENTERED AUTOMATION • keeping the human informed • keeping the human trained • keeping the operator in the loop • selecting appropriate stages and levels when automation is imperfect (fig16.2) • making the automation flexible and adaptive • maintaining a positive management philosophy • SUPERVISORY CONTROL AND AUTOMATION-BASED COMPLEX SYSTEM • automation is not optional, but necessity -- production of continuous quantities (chemical process control), production of discrete quantities (manufacturing control), robotics control • how to support the supervisor in times of failures and fault management knowledge-based behavior, predictor displays, ecological interface • robotics control in manufacturing and in navigating UAV • hortatory control – the systems being controlled retains a high degree of autonomy
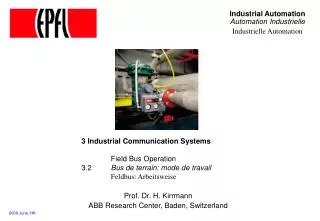
Action selection and choice (Ex. TACS) Info. Acquisition, selection, & filtering (ex. spellchecker) Control and action execution (Ex. Cruise control) Info. Integration (ex. Predictor display
17. Transportation Human Factors • AUTOMOTIVE HUMAN FACTORS • Task Analysis of the Vehicle Roadway System Strategic, Tactical, and Control Aspects of Driving • strategic tasks – deciding where to go, when to go and how to get there • tactical tasks – choice of maneuvers and immediate goals in getting to a destination such as speed selection, the decision to pass another vehicle, and the choice of lanes • control tasks – moment-to-moment operation of the vehicle such as maintaining a desired speed, keeping the desired distance from the car ahead, keeping the car in the lane Control Task • two-dimensional tracking task of vehicle control • the lateral task of maintaining lane position – 2nd-order control task with preview and a predictor the best measure is the time to lane crossing (TLC) • longitudinal task as a first-order tracking task of speed keeping • three channels of visual information to be tracked along the two axes • lateral tracking by the roadway curvature • longitudinal tracking by the flow of motion along the roadway and the location or distance of hazards and traffic control devices
Multitask Demands • primary control task -- lane keeping and roadway hazard monitoring dependent upon primary vision attention lobe (PVAL) of information (fig 17.1 and 17.2) • inattention, competing visual tasks • secondary motor activity – conflict with monitoring and processing and visual information in the PVAL Cabin Environment • create the simplest, most user-friendly design of the internal displays and controls • Displays– high contrast, interpretable, easy to read • Task environment within the vehicle – avoid unnecessary features and gizmos • Controls – consistently located, adequately separated, compatibly linked to displays • Visibility Anthropometry • anthropometric factors of seating – reachability of different controls • design for the mean is not appropriate -- controls accessible and interpretable Illumination • adequate highway lightning, adequate reflectors Signage • minimize visual clutter from unnecessary signs • locate signs consistently • identify sign classes distinctly – color, shape • allow signs to be read efficiently
Resource Competition • serious distraction of in-cab viewing – thenumber and duration of glances – feel safe less than 0.8 sec/glance, 3 sec between glances • auditory display, speech recognition, HUD • Hazards and Collisions Control Loss • slick or icy road conditions, narrow lanes and momentarily lapses in attention, rapid over-correction (minor lane departure) – roadway departure because of fatigue • directly related to the bandwidth of correction – vehicle speed • Visiblemarkings of lane edges, turtles, rumblestrips Hazard Response • poor visibility and inattention can cause a failure to detect hazards • the time to react to unexpected objects (the perception-reaction time or brake reaction time) – 1 to 2 sec (0.2 to 0.3 sec from accelerator to brake), mean of 1.5 sec Speeding • quadruple threat to driver safety – (1) increases the likelihood of control loss; (2) decreases the probability of detecting hazard in time; (3) increases the distance traveled before a successful avoidance maneuver; (4) increases the damage at impact (fig 17.3) • why do people speed? • perceptual biases (underestimating true speed) – size biased distance judgments; bias to overspeed (quieter engines, higher seating position above the ground, less visible ground texture), adaptation • cognitive biases (overestimating the ability to stop in time)
Risky Behavior • cognitive biases to overspeeding – overconfidence (underestimation of risk), expectancy (no experience of a collision – little effect on the behavior of survivors) • The Impaired Driver Fatigue • over 50% of the accidents leading to the death of a truck driver and over 10% of all fatal car accidents Alcohol • the most effective interventions may be social norming Age • Young drivers – Less skilled and knowledgeable, overconfidence • Eldery – Information processing impairments Impairment Interactions • Driving Safety Improvements (Haddon’s Matrix, table 17.2) Driver Characteristics: Training and Selection • higher accident rates were related with limited skills (for the very young driver) and limited information processing abilities (for the elderly) • graduated licensing for younger drivers, more frequent driving test • the standard visual acuity test – very little relevance for driving dynamic visual acuity Driver Characteristics: Driver Adaptation and Risk Calibration • risk homeostasis model – partially consistent motive for driving faster and force of habit • any safety intervention must consider the tendency for people to adapt to the new situation
Driver Characteristics: Regulatory Compliance • effective enforcement of speed limits can make a difference – automatic speed management system, automated systems for issuing tickets Driver and Vehicle Characteristics: Fitness to Drive • driver monitoring system -- monitoring the vehicle (e.g., steering behavior) and the driver (e.g., blinking rate, EEG) Vehicle Characteristics: Sensing and Warnings • high mounted brake lights, trilight system Roadway Characteristics: Expectancy • positive guidance, light cycle • expectancy and standardization on sign location and interaction design • reduce the consequence of an accident – seat belt, airbag, guardrail for SUVs Driver and Vehicle Characteristics: Use of Protective Devices • AUTOMATIVE AUTOMATION • Intelligent Transportation System (ITS) – collision warning systems, automated navigation systems, driver monitors – GPS system, traffic sensing devices, digital map database, wireless connection • user trust and complacency • attention may be drawn more into the vehicle • introduce a new type of productivity and safety tradeoff in driving
PUBLIC GROUND TRANSPORTATION • Maritime Human Factors • fatigue and crew reductions • extremely sluggish in their handling qualities, benefiting from predictive displays • Aviation Human Factors • The Tasks • primary multiaxis tracking task -- aviating • maintaining situation awareness, navigating to three-dimensional points, following procedures, communicating with controllers and other pilots, monitoring system status • competition -- visual, perceptual, cognitive, and response-related resources Tracking and Flight Control • 6 degrees of freedom of motion • rotational axes -- pitch, roll (or bank), and yaw • translational axes – lateral, vertical, and longitudinal • two primary goals • aviating -- keeping the plane from stalling by maintaining adequate air flow over the wings, which produces lift control of the airspeed and attitude (pitch and roll) • navigate the aircraft to points in the 3-D airspace (4-D navigation with time) • yoke controls the elevators and ailerons – pitch and bank (first-order dynamics) • throttle controls airspeed • rudder pedals help coordinate turning and heading changes
three facets make the multielements tracking task much more difficult • displays do not show a good, integrated, pictorial representation of the aircraft • the dynamics of several aspects of flight control are higher order • the axes often have cross-couplings Maintaining Situation Awareness • achieving SA through display design -- HUD Following Procedures • to assist the pilot’s prospective memory – knowledge in the world in the checklist • two kinds of errors in following checklists • top-down processing (coupled with time pressure) may lead to see the item in its appropriate state, even if it is not • distractions can lead the pilot to skip a step in the checklist • redundant participation, automation • The Social Context • breakdowns in pilot team performance junior vs. senior CRM (cockpit/crew resource management) • Supporting the Pilot • maintenance technicians and their inspection and trouble shooting skills • aircraft automation – human-centered automation • air traffic control
Figure 17.1 Representation of the driver’s information-processing tasks. The top of the figure depicts the tracking or vehicle control tasks involved with lane keeping and hazard avoidance. The bottom of the figure presents the various sources of competition for resource away from vehicle tracking. These may be thought of as secondary tasks.
Figure 17.2 Representation of the PVAL from the forward view, top view, and side view.
Figure 17.3 The components of the hazard response time, which is the time required to stop before contacting a hazard, the influences on these components, and the need to maintain a positive safety margin between the time required and the time available. Time available will be inversely proportional to speed.
Figure 17.4 Fatality rate as a function of age and gender. (source: Evans, L., 1988. Older driver involvement in fatal and severe traffic crashes. Journal of Gerontology: Social Science, 43(5), 186-193)