Download
1 / 43
440 likes | 565 Views
Highlights of the Ready Mixed Concrete Industry Data Report. Presented to the 46 th Annual Business Administration Conference by William B. Allen Allen Villere Partners. Benchmarking. Assists in helping to analyze the cost of doing business

E N D
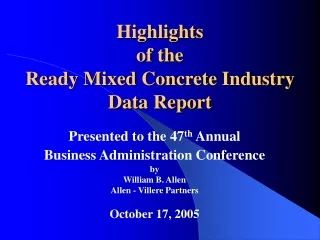
Highlights of the Ready Mixed Concrete Industry Data Report Presented to the 46th Annual Business Administration Conference by William B. Allen Allen Villere Partners
Benchmarking • Assists in helping to analyze the cost of doing business • Assists in helping to analyze the efficiency of an operation
Surveys Available • Industry Data Survey • Fleet Benchmarking Survey • Safety Survey • Wage & Benefits Study
The Industry Data Survey • Company Size Analysis By % Sales & $-Per-yd • Regional Analysis By % Sales & $-Per-yd • Rural, Urban & Mixed Area Type Analysis • Five Year Trend Analysis
Ready Mixed Concrete Profitability $ Per Yard
Cement Prices vs Ready Mix Prices 1st Quarter of 1980 to 4th Quarter of 2002
SummaryWhat Can We Do To Improve Our Bottom Line? • Compare Strengths & Weaknesses to Peers • Improve Your Management Financial Cost Data (Use NRMCA’s Chart of Accounts) • Know Your Break-even Point • Cost Out Jobs (Use NRMCA’s Job Cost Program) • Price Jobs Based On A Desired Return