Download
1 / 17
170 likes | 277 Views
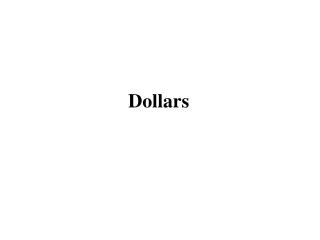
Dollars to the Classroom. Interim Study Presentation by State Rep. David Brumbaugh. Education (Public & Higher). Makes up 56% of the State Budget *. * Oklahoma State Budget. Facts:. Oklahoma is a relatively Low Income State – ranks 40 th in the US Private Sector in Job Pay

E N D
Dollars to the Classroom Interim Study Presentation by State Rep. David Brumbaugh
Education(Public & Higher) • Makes up 56% of the State Budget* * Oklahoma State Budget
Facts: • Oklahoma is a relatively Low Income State – ranks 40th in the US Private Sector in Job Pay • However, Oklahoma ranks High – 26th in US in Spending on Education as % of personal income
By some StatisticsOklahoma Taxpayersspend $5.4 billion on Education$8,411 per pupil *(per school year) * Friedman Foundation (2011)
Dedicated Revenuesare funneleddirectly to Schoolswithout goingthrough theAppropriations Process * * Oklahoma Council of Public Affairs (OCPA)
Spending per Student* * “Why School Systems Cannot Lose Weight” by Dr. Chester Finn Jr. Harvard University
Actual Costs per StudentCloser to $10,257.00Statistics do not include*: • Debt Service • Career Tech • Bursars • Retirement (pensions) • Depreciation (building & assets) * Oklahoma Council in Public Affairs – Spending & School Performance
Overhead Student Support Services 7% Aides & Coordinators 10% Other (bus, cafeteria, etc. 19% Only 51% of State Public Education Employees are Teachers. * “The Blob that Ate the Schools” by Greg Forster
Tulsa County Public Schools Students vs. Employees * * Source: Tulsa County Assessor Statistics and Analysis
Education Week*ranks Oklahoma 46th in the Country in$ to the Classroomyet,22nd in Administration Costs * Education Week – 2009
28%* of Studentsin Oklahomadrop out of High School(Alarming State Statistic) * Tulsa World article
Some Oklahoma College Officials state that only 18%* of the students they are getting today are preparedfor college – Large % have to takeRemedial Intro English, Science, Math Courses (Freshman Year) * Oklahoma College Report
Terms* such as: Represent almost half of all costs (44%**) • Student Support • Instructional Support • District Administration • District Support • School Administration • Other & Debt Service According to State Board of Education **Board of Accountability statistics are higher * Just other terms for non-instructional costs
Certain Administration Services Food Services Janitorial Medical Services (cuts out salaries & benefits in areas that can be privatized and allows for competitive bidding and increased quality) Employ Business Analytics to reduce improper payments Shared Services Streamline Supply Chain Control Pension Costs Facility Costs Utility Savings (reduce energy costs) Stop rotating and supplementing the 10% of underperforming teachers (supplemental costs & waste) Examples of Solutions * Privatize and Job Out: Savings Realized Through: Requires greater transparency at State & Local Level * Dr. Greg Foster Foundation of Educational Choice
Tulsa Public SchoolsPercent of 1967-68 Operating Budget*: • Instruction 73.0% • Operation of Plant 12.4% • Maintenance of Plant 4.2% • Fixed Charges 5.2% • Administration 3.5% • Auxiliary Services 1.7% * Tulsa Public Schools Bulletin 1969
Tulsa Public SchoolsClass of 1967 High School Graduates Attending College • A follow-up study of the Class of 1967 shows that 56% of these students enrolled in colleges or universities. An additional 6.9% attended other types of special schools. * Honor Students Of the 10,836 college sophomore grades recorded for Tulsa’s graduating class of 1960, 18.1% were A and 32.2% were B. Approximately 85% were average and better. * * Tulsa Public Schools Bulletin 1969