Download
1 / 31
310 likes | 454 Views
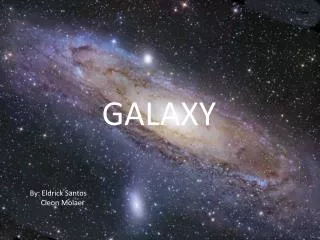
Galaxy Voids. by Chooi Fei Ng and Aron Cooper. This false-color optical map, covering about 4300 square degrees, or 10 percent of the sky, shows the distribution in space of some 2 million galaxies. Void. Voids are the dominant feature and have a typical diameter of ~ 30Mpc.

E N D
Galaxy Voids by Chooi Fei Ng and Aron Cooper
This false-color optical map, covering about 4300 square degrees, or 10 percent of the sky, shows the distribution in space of some 2 million galaxies.
Void • Voids are the dominant feature and have a typical diameter of ~ 30Mpc. • Voids are very underdense region, δρ/ρ~0.95 • Up to 40% of volume of the universe is occupied by voids • The largest void observed, Bootes void, has a diameter of about 124Mpc.
What is in a void? • A few unusually faint galaxy, void galaxies • Mostly Dark Matter – CDM model Void Boundaries • Rather smooth, defined by galaxies with a broad range of luminosity, especially star forming galaxies
Observation- Redshift surveys • PSCz Redshift Survey • Catalogue of detections with the Infra-Red Astronomical Satellite (IRAS) • 15411 galaxies with redshift • Covers 84% of the sky • UZC(Updated Zwicky Catalog) • Center for Astrophysics (CfA) Optical Redshift survey • 18633 galaxies with redshift
Void Finding Algorithm • Wall and field galaxies • Categorize each galaxy in the sample as a wall galaxy or a field (void) galaxy • Specify a length ln such that any galaxy that does not have n neighbors within a sphere of radius ln is classified as field galaxy. N = 3 for our choice • Place the wall galaxies onto a three dimensional grid • Beginning from the center of each empty grid cell, grow the largest possible sphere containing no wall galaxies and keep track of the radius of each hole • The largest hole found is automatically a void • Then, we test the second hole and if it overlaps the previous void by F% in volume, then it is a member of the first void rather than a new void. If not, it forms a separate void. • We continue like this for all holes with radii larger than 10h-1 Mpc
Result from Voids Finding Algorithm • Shows the number of voids we find for the PSCz(dashed line) and the UZC(solid line) as a function of the overlap fraction for which the hole is still considered a separate void
Recovering volume of voids • If the voids are highly elliptical, we will not detect them at the corners of the ellipse • Test this by generating data containing mock voids of known elliptical shape • Run the simulated data through our void finding algorithm and compare the volume obtained with the known volume of the void
If voids are spherical in shape we recover 100% of the volume. • The more elongated it becomes, the less of the volume we detect
PSCz UZC • Show the super galactic coordinates (x,y) for different values of z. • Each panel shows a 10h-1Mpc slice • Shaded regions are the voids. • The points are the wall galaxies and the empty squares show the void centers
Conclusion • Different samples from the same survey yield the same voids • We detect the same voids in different redshift surveys
Study of Voids Using N-Body Simulations Chooi Fei Ng and Aron Cooper
Outline • Motivation for using simulations • Basic information about simulations used • Void characteristics as determined using a variety of analysis tools • Void Probability Function (VPF) • Nearest Neighbor Distances • Void Finder Algorithm (VF) • Characteristics of Void galaxy populations
Motivation • Why use simulations to study voids? • Compare simulation results with observations • Verify/Constrain cosmological models • Structure formation • Cosmological parameters • Initial conditions • Give some indication of Galaxy formation process • Special void population of galaxies • Better understand galaxy bias • If no bias, galaxy mass distribution is equal to that of DM
N-Body Simulations Used • Three used: GIF, GIF-II, and 5123 • GIF and GIF-II only vary with initial conditions • Use Dark Matter Particles only • Cosmological Parameters Used: • “Special” methods applied to predict galaxy distribution and properties (details omitted)
Void Probability Function (VPF) • VPF: Probability that a random sphere of radius R will have no points/matter within it • Statistic is calculated for: DM, Galaxies, and random distribution of points with # density = n_gal • Results: • DM and galaxies have more larger voids due clustering than the random distribution of points • VPF for large R is much higher for galaxies, than for DM, i.e. more large voids in galaxies due to bias • Selection effects: small DM halos in voids may form galaxies, but they are not bright enough to meet brightness criteria
Comparison to Observation for VPF • For R <~ 8 h^-1MPc: • Galaxy samples match observations • DM produce low VPFs with regards to observations • For R > 8 h^-1MPc: • DM VPF agrees with the observations • Galaxy samples over-predict observed VPF • However, both DM and galaxy VPFs are within the uncertainties of the observed data.
Nearest Neighbor Distribution • Define: • Bright “ordinary” galaxies defined as those brighter than magnitude Mord • Faint “test” galaxies defined as those in a particular, fainter, magnitude range Mtest • Dt0 the distance from a test galaxy to the nearest ordinary galaxy • D00 the distance from an ordinary galaxy to the nearest ordinary galaxy
Results from Nearest Neighbor • D00 distribution shifts to larger average distances for brighter ordinary samples • These type of “ordinary” galaxies are generally found near the centers of massive DM halos (large clusters) • Rarely another galaxy of comparable magnitude found in cluster • Dt0 is generally smaller than D00 in this case. • Dt0 distribution shifts to larger average distances for faintest ordinary samples • Fainter test samples fill in voids defined by ordinary galaxies • Typical Dt0 being ~50% larger than typical D00
Variation in Void Sizes from Void Finder 512 survey incomplete • Rapid decline in # density of voids for larger R, as predicted by VPF • Still more larger voids in galaxies than there are in DM • Fractional overdensity in voids 0.1 or less. Prediction by Sheth (2002)
Examination of Void Population using VF • Examine the prevalence of “void” galaxies and structure surrounding VF candidates. • Determine Void Density Profiles: • First, determine number density of galaxies in concentric shells centered on center of void. • Scale all lengths using the void radius so voids of all sizes can be compared. • These number densities are summed for all voids of a particular range of radii
Void Density Contrast Profiles from VF Open circles denote DM • Voids are highly underdense, more so for galaxies than for DM • Outside Threshold, density contrast becomes larger for galaxies than it is for DM. • Clear threshold corresponding to edge of void at about r/Rvoid = 1 • Indicates VF works • Density contrast in voids: • Little variation • Population dependent
Void Galaxies vs. Field Galaxies (VF) • Halo mass function • Much lower for Void galaxies in relation to that of the Field galaxies • Median occupied halo mass • 6 times lower for void galaxies
Specific Star Formation Rate (VF) Open indicates only galaxies at halo centers • Star Formation Rate • Higher towards centers of voids • Outside voids there exist very massive halos w/numerous satellite galaxies • In model used these galaxies have lost their fresh gas • In model specific star formation rate is higher in lower mass (dimmer) stars • See filled squares v. open squares Squares
Void Galaxy Properties • Void galaxies found to have systematically different properties • Fainter • More blue • Tend to be disk-dominated • Higher star formation rates • Reasons for property variation: • Lower DM halo mass function than field galaxies • More clustering of galaxies outside of voids • Less gas available to galaxies that have existed in clusters for a long period of time
Conclusions • A wealth of information about voids can be obtained using simulations • Better data for larger sky surveys needs to be analyzed for an accurate comparison to observations, i.e. SDSS, 2dFGRS • Galaxies in voids tend to have share similar characteristics • It is still unclear if these galaxies constitute their own population