Download
1 / 28
280 likes | 378 Views
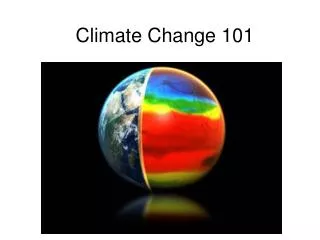
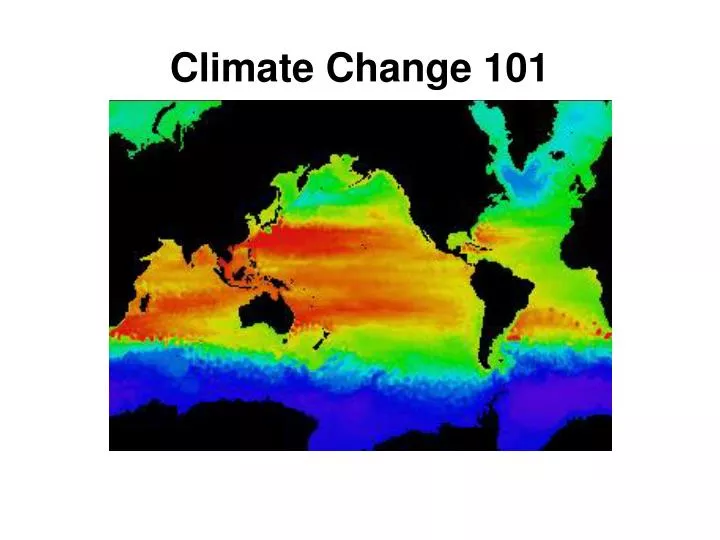
Climate Change 101. Everything I know about Climate Change I learned at the movies…. 1995. 2004. 2006. Presentation Outline. Greenhouse Effect Energy sources Emissions Correlation Future Trends. Notes.

E N D
Everything I know about Climate Change I learned at the movies… 1995 2004 2006
Presentation Outline • Greenhouse Effect • Energy sources • Emissions • Correlation • Future Trends
Notes • Although the Earth’s atmosphere consists mainly of oxygen and nitrogen, neither plays a significant role in enhancing the greenhouse effect because both essentially transparent to terrestrial radiation. The greenhouse effect is primarily a function of the concentration of water vapor, carbon dioxide and other trace gases in the atmosphere that absorb the terrestrial radiation leaving the surface of the Earth. Changes in the atmospheric concentrations of these greenhouse gases can alter the balance of energy transfers between the atmosphere, space, land and oceans. A gauge of these changes is called radiative forcing. Holding everything else constant, increases in greenhouse gas concentrations in the atmosphere will produce positive radiative forcing (i.e., a net increase in the absorption of energy by the Earth). • Water Vapor (H2O) is the most abundant and dominant greenhouse gas in the atmosphere. Water vapor is neither long-lived nor well mixed in the atmosphere, varying spatially from 0 to 2 percent. In addition, atmospheric water can exist in several physical states including gaseous, liquid, and solid. Human activities are not believed to affect directly the average global concentration of water vapor, but, the radiative forcing produced by the increased concentrations of other greenhouse gases may indirectly affect the hydrologic cycle. • As we will soon see, CO2 is by far the most abundant anthropogenic greenhouse gas, so other gases are set to units equivalent to CO2. What is important to note, however, is that some gases have quite large affects and stay in the atmosphere for long periods of time. • Sulfur hexafluoride is an insulator used in electrical equipment and switches, carbon tetrafluoride is one of a family of perfluorocarbons mostly emitted from the smelting of aluminum)
Source: EPA Global Warming site. http://yosemite.epa.gov/oar/globalwarming.nsf/content/climate.html
Effects of Different Greenhouse Gases Source: US EPA: US Greenhouse Gas Inventory Reports 2008 http://epa.gov/climatechange/emissions/usinventoryreport.html
Presentation Outline • Greenhouse Effect • Energy sources • Emissions • Correlation • Future Trends
Fossil FuelsWorld’s Dominant Energy Source World (2005) 462 Quads/yr (4.87e14 MJ) 86% Fossil Energy United States (2005) 100 QBtu/yr (1.06e14 MJ) 86% Fossil Energy Renewables (solar, wind, geothermal, biomass) 3% Gas 23% Gas 23% Coal 26% Coal 23% Nuclear 8% Nuclear6% Hydro 3% Renewables 8% Oil 41% Oil 37% World Data from International Energy Outlook 2007 http://www.eia.doe.gov/oiaf/ieo/world.html. U.S. Data from Annual Energy Outlook 2008 http://www.eia.doe.gov/oiaf/aeo/fuel.html
Energy - USA Energy Requirements 2005 Oil 40% 100 Quads Renewables 6% Coal 26% Fossil fuels provide 86% of energy Gas 20% Nuclear 7% + 31% 2030 Oil 41% 131 Quads Coal 23% By 2030, reliance on fossil fuels remains stable at 86% Renewables 6% Gas 23% Nuclear 8% Source: AEO 2007
Renewable Energy Consumption – Growing Fast BUT from a Small Base 2005 6.3 Quads + 118% 2030 13.7 Quads Source: AEO 2008
Presentation Outline • Greenhouse Effect • Energy sources • Emissions • Correlation • Future Trends
All Fossil Fuels and Energy SectorsContribute CO2 Emissions United States Carbon Dioxide Emissions by Source and Sector Transportation 32% Residential 21% Natural Gas 20% Commercial 18% Industry 29% Coal 36% Oil 44% AEO2007
CO2 and CH4 - The Primary GHG Contributors United States Greenhouse Gas Emissions Equivalent Global Warming Basis Other CO2 2% Methane 9% CO2 from Energy 83% Nitrous Oxide 5% HFCs, PFCs, SF6 2% “EIA Emissions of Greenhouse Gases in the U.S. 2005”
Carbon Intensity is falling… Carbon Intensity By Region, 2001-2025 (Metric Tons of C Equivalent per Million $1997) World Carbon Dioxide Emissions By Region, 2001-2025 (Million Metric Tons of C Equivalent) …But Carbon Dioxide Emissions are growing
The Budget is Disappearing Cumulative Carbon Emissions 1900-2100 (GtC) Spent Remaining Budget for 450 ppm Stabilization Source: Dave Hawkins, NRDC, presented at Keystone Energy Forum, Feb. 2004
Presentation Outline • Greenhouse Effect • Energy sources • Emissions • Correlation • Future Trends
CO2 Concentrations on the Rise(~280 ppm to 370 ppm over last 100 years) 350 CO2 Concentration (ppmv) 300 CO2 (Vostok) 250 200 2 0 Temperature Change from Present (oC) DTatm (Vostok) -2 -4 200 150 100 50 0 Time Before Present (kyr)
Source: Intergovernmental Panel on Climate Change - http://www.ipcc.ch/present/graphics.htm
Presentation Outline • Greenhouse Effect • Energy sources • Emissions • Correlation • Future Trends
Possible Harbingers… • Rising sea levels • Spreading disease • Shifting in seasons (e.g., earlier spring arrival) • Shifting ranges of plant and animal • Changes in animal and plant populations • Bleaching of coral reef • Melting permafrost melting • Increased catastrophic weather (e.g., heavy snowfalls, flooding, ice storms, droughts, fires)
Permafrost and polar ice are melting… Source: http://www.arctic.noaa.gov and National Climatic Data Center, NOAA
Precipitation is erratic Source: National Climatic Data Center, NOAA
Significant Climate Anomalies Source: National Climatic Data Center, NOAA
What do you think? Insert your thoughts here.....