Download
1 / 8
80 likes | 238 Views
Child Poverty Unit: Basket of Indicators. March 2012 Research and Measurement Team Child Poverty Unit. Basket of indicators.

E N D
Child Poverty Unit: Basket of Indicators March 2012 Research and Measurement Team Child Poverty Unit
Basket of indicators • In Autumn 2010, as part of the Needs Assessment Toolkit, we provided local authorities with information about data sources they could use to investigate issues relating to child poverty in their areas • We have now updated the basket of indicators to: • Align it to the indicators set out in the Child Poverty Strategy to monitor progress • Reflect the fact that some data is no longer available • Include further data sources of value to understanding child poverty in your local area • Provide local areas with the most up to date data • We welcome your feedback on the basket of indicators data tool • The tool released in Autumn 2010 can be found at: http://media.education.gov.uk/assets/files/xls/c/child%20poverty%20basket%20of%20indicators.xls
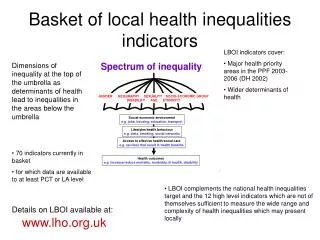
The Indicators • Family Resources • Child poverty • Average earnings of employees in area • Time to process HB/CTB new claims (no.) • Number of households on LA waiting lists • Amount of new affordable housing • Children’s Life Chances • Inequality gap in achievement at L2 by 19 (%) • Children in care achieving 5 A*-C GCSEs • FSM/non-FSM achievement gap at KS2 • FSM/non-FSM achievement gap at KS4 • SEN/non-SEN achievement gap at KS4 • Young people from low incomes entering higher education • FSM/non-FSM gap in young people from low income backgrounds entering higher education • Under 18 conception rate • Working age population qualified to at least L2 • The percentage of live births under 2.5 kg • Young offending rate (10-17 yr) • Life expectancy at birth (males) • Life expectancy at birth (females) • The proportion of under weight children in reception year • The proportion of obese children in reception year • The proportion of under weight children in reception year • The proportion of obese children in reception year • The proportion of persistently absent children • Infant mortality • Children in need • Early Years Foundation Stage Profile (EYFSP) • Family Circumstances • Adults with learning disabilities in employment • Working adults seeking mental health services • Overall employment rate • Overall employment rate – female • Overall employment rate – male • The proportion of children in workless households • The proportion of children in working households • The proportion of 16-18 year old NEETs • Other • Working people with access to public transport • People on IB in homes with low energy rating • People on IB in homes with high energy rating • Internal migration of under 16s
Updated: Basket of Indicators Summary Sheet Pull down to select your local authority Updated to include the 2009 revised local child poverty measure The indicators have been updated and are organised by strategy theme rather than by building block An other section has been added for those indicators that don’t fit into a theme
Updated: Percentile Rank Charts The charts have been updated to be organised by strategy theme rather than by building block Additional indicators have been added in
New: Strategy Indicators Summary This sheet has been added in so that you can make comparisons between the national strategy indicators and local strategy indicators National strategy indicators Closest local level indicators
New: Strategy Indicator Charts This sheet has been added in so that you can see where we are with the national indicators
Questions or suggestions of improvements to the basket? • Are there any indicators you think we should be including and haven’t? • Are you happy with the way the data has been presented? • Anything else? • Contacts.CPU@childpovertyunit.gsi.gov.uk