Download

1 / 16
160 likes | 315 Views
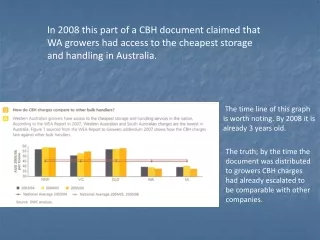
In 2008 this part of a CBH document claimed that WA growers had access to the cheapest storage and handling in Australia. The time line of this graph is worth noting. By 2008 it is already 3 years old.

E N D
In 2008 this part of a CBH document claimed that WA growers had access to the cheapest storage and handling in Australia. The time line of this graph is worth noting. By 2008 it is already 3 years old. The truth; by the time the document was distributed to growers CBH charges had already escalated to be comparable with other companies.
CBH Historic Charges 2005/06 It clearly shows a rapid increase in base CBH charges after the period of the previous graph. Previous Graph Period
The domestic feed barley scenario shows CBH having the highest costs in 2008 with further increases in 2009. .
The domestic feed barley scenario shows CBH having the highest costs in 2008 with further increases in 2009. Further increases in 2009/10.
. CBH has the greatest increase in charges for export wheat & barley between 07/08 & 08/09. An increase in revenue direct from the farm, an added cost of production.
Domestic outturn charges have increased by 43.5% in the last 2 years.
Australia FOB $21 - $25Note: This cost includes all stevedores, harbour dues, security, receivals fees into the port, shipment slot booking fees, port loading fees, rebates, certificates, agents, WEA Peter McBrideGeneral Manager - Corporate Affairs AWB Ltd
Ukraine $19.10 - $22.47 FOBIn Australian Dollars based on an A$ exchange rate of 89cents Peter McBride General Manager - Corporate Affairs AWB Ltd
Comparative Export Costs for Handling Grain:Canadian ‘Mandatory’ Tariffs 2009/10 CANADIAN GRAIN COMMISSION SUMMARY LICENSED (EXPORT) TERMINAL ELEVATOR TARIFFSVancouver Tariff charges range from Can $ 8.08 to Can $ 10.00Source:http://www.grainscanada.gc.ca/statistics-statistiques/tariff-tarif/tt/terminal10-01-22.pdf Average “mandatory” Canadian Export FOBBING Costs charged to the Canadian wheat producer: Approximately US$ 9.00 per MT
Germany / France $6.06 - $7.57 FOBIn Australian Dollars based on an A$ exchange rate of 89cents Peter McBride General Manager - Corporate Affairs AWB Ltd
USAFOBIn Australian Dollars based on an A$ exchange rate of 89cents $4.12 - $6.19 Note: US ports are cheaper for the following reasons 1. Through put volume 2. River system (a more natural port system with significantly less set up cost and capitalisation) 3. Ports pay demurrage - dispatch. ie the port earns dispatch, thus they attract contestable tonnes with lower fobbing rates and make it back on the dispatch) 4. Ports treat/view fobbing as a tradable commodity and adjust price with supply and demand (linked to point one and revenue from volume through put) Peter McBride General Manager - Corporate AffairsAWB Ltd