Download
1 / 38
390 likes | 561 Views
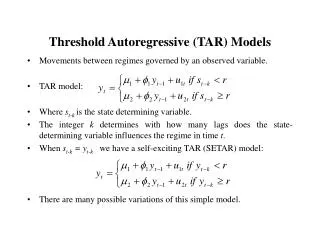
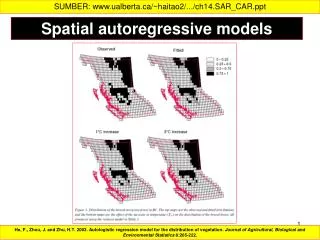
Shrinkage Estimation of Vector Autoregressive Models. Pawin Siriprapanukul pawin@econ.tu.ac.th 11 January 2010. Introduction (1). We want to forecast: The rate of growth of employment, The change in annual inflation, The change in federal fund rate.

E N D
Shrinkage Estimation ofVector Autoregressive Models Pawin Siriprapanukul pawin@econ.tu.ac.th 11 January 2010
Introduction (1) • We want to forecast: • The rate of growth of employment, • The change in annual inflation, • The change in federal fund rate. • A standard and simple system approach in economics is the VAR.
Introduction (2) • OLS provides the efficient estimator for the VAR. • However, there are a lot of evidences showing that Bayesian VAR outperforms unrestricted OLS VAR in out-of-sample forecasting: • Litterman (1986), and Robertson and Tallman (1999).
Introduction (3) • Banbura et al. (2008) also show that it is possible and satisfactory to employ many endogenous variables with long lags in the Bayesian VAR (131 var, 13 lags). • We see some studies following this direction.
Introduction (4) • There is another related literature in forecasting using large number of predictors in the model. • A popular method is the “Approximate Factor Model”, proposed by Stock and Watson (2002).
Introduction (5) • In this literature, it was shown that using larger number of predictors (independent variables) does not always help improve the forecasting performances. • Bai and Ng (2008) show that selecting variables using the LASSO or the elastic net, before applying the methodology of the approximate factor model can outperform bigger models.
Introduction (6) • Even they interpret their results differently, we see that this is an evidence of redundancy of models with large predictors. • Now, considering VAR with large endogenous variables and long lags, we think that redundancy should be the case as well.
Introduction (7) • We have not gone into VAR with large endogenous variables yet. But we are working with 13 lags in the VAR.
Bias-Variance Tradeoff (1) • Suppose OLS estimate is unbiased. • Gauss-Markov Theorem: • OLS estimate has the smallest variance among all linear unbiased estimates. • However, we know that there are some biased estimates that have smaller variances than the OLS estimate.
OLS; Unbiased, but High Variances True Model x x Shrinkage; Biased, but Small Variance Bias-Variance Tradeoff (2)
VAR (1) • We consider a VAR relationship. • Note here that we cannot write the bias-variance tradeoff for the VAR. • The OLS estimate is biased under finite sample. • We still think similar logic applies. However, direction of shrinkage may be important.
VAR (2) • With T observations, we have: where We assume
VAR (3) • The unrestrictedOLS estimator is: • This estimator may not be defined if we have too many endogenous variables or too many lags.
Bayesian VAR (1) • This is a shrinkage regression. • We follow Kadiyala and Karlson (1997) and Banbura et al. (2008) to use the Normal-(Inverted)-Wishart as our prior distribution. • We work with stationary and demeaned variables. Hence, we set the mean of prior distribution at zero.
Bayesian VAR (2) • We can write the (point) estimator of our Bayesian VAR estimate as: • where
Ridge Regression (1) • Well-known in statistical literature. • Can be defined as: • This is a regression that imposes a penalty on the size of the estimated coefficients.
Ridge Regression (2) • The solution of the previous problem is: • Observe the similarity with:
BVAR v RR (1) • Proposition 1: • BVAR estimator can be seen as the solution of the optimization problem: • where is the (j,j)-th element of the matrix .
BVAR v RR (2) • Proposition 2: • Let , we have: • Where • Note: If , is just standardized .
LASSO (1) • Least Absolute Shrinkage and Selection Operator. • The LASSO estimate can be defined as:
LASSO (2) • LASSO is proposed because: • Ridge regression is not parsimonious. • Ridge regression may generate huge prediction errors under sparse matrix of true (unknown) coefficients. • LASSO can outperform RR if: • True (unknown) coefficients are composed of a lot of zeros.
LASSO (3) • If there are a lot of irrelevantvariables in the model, setting their coefficients at zeros every time can reduce variancewithout disturbing the bias that much. • We see that VAR with 13 lags may possess a lot of irrelevant variables.
The Elastic Net (1) • Zou and Hastie (2005) propose another estimate that can further improve the performance of LASSO. • It is called the elastic net, and the naïve version can be defined as:
The Elastic Net (2) • We modify the elastic to allow treating different lagged variables differently. • Our modified naïve elastic net is:
Implementation • We can use the algorithm called “LARS” proposed by Efron, Hastie, Johnstone, and Tibshirani (2004) to implement both LASSO and EN efficiently. • This can be applied to our modified version as well.
Empirical Study (1) • I use the US data set from Stock and Watson (2005). • Monthly data cover Jan 1959 – Dec 2003. • There are 132 variables. But I use only 7. • I transformed the data as in De Mol, Giannone, and Reichlin (2008) to obtain stationary. • Their replication file can be downloaded. • Their transformation make every variable to be annual growth or change in annual growth.
Empirical Study (2) • Out-of-sample performances. • In each month from Jan 1981 to Dec 2003 (276 times), regress one model using the most recent 120 observations, to make one forecast. • The performances are measured using Relative Mean Squared Forecast Errors (RMSFE), using OLS as the benchmark regression.
Empirical Study (3) • There are 3 variables that we want to forecast: • The employment (EMPL) • The annual inflation (INF) • The Federal Fund Rate (FFR). • The order of VAR is p = 13. • There are 4 forecast horizons (1,3,6,12), and 3 values of (0,1,2).
Empirical Study (4) • The most time-consuming part is to figure out suitable parameters for each regression. • We use grid searches on out-of-sample performances during the test period Jan 1971 – Dec 1980 (120 times). • Bayesian VAR: We employ the process in my previous chapter. • LASSO: A grid of 90 values. • Modified Elastic Net: A grid of 420 pairs of values.
Empirical Study (5) • We also employ the combination of LASSO and Bayesian VAR as well. • LASSO discards some variables that tend to correspond with zero true coefficients. • Bayesian VAR is similar to ridge regression, which assigns better amount of shrinkage to positive coefficients.
Empirical Study (6) • For the smallest model, we use the 3 variables to forecast themselves.
Empirical Study (9) Comparing different regressions. Pi = 0
Empirical Study (10) Comparing different regressions. Pi = 0
Empirical Study (11) When we change to 7-variable VAR.
Conclusion • Even the empirical results are not impressive, we still think this is a promising way to improve the performances of Bayesian VARs. • When the model becomes bigger, e.g. models with 131 endogenous variables, this should be more relevant. • We can think of some cautions like Boivin and Ng’s (2006) for the VAR as well.