Download
1 / 32
330 likes | 437 Views
LeanSigma ® Facilitator Training. Module 10 – Process Smoothing. Topics. Process Smoothing 5S……………………………………………………………………………………….5 – 8 Capacity and Demand management……………………………….9 – 27 FMEA (risk analysis)……………………………………………………....……15 - 16

E N D
LeanSigma® Facilitator Training Module 10 – Process Smoothing
Topics Process Smoothing • 5S……………………………………………………………………………………….5 – 8 • Capacity and Demand management……………………………….9 – 27 • FMEA (risk analysis)……………………………………………………....……15 - 16 • Routing standardization……………………………………………………….21 - 23 • Capacity (workforce) studies……………………………………………….24 – 27 • Standard Operations………………………………………………………28 - 32
This module will focus on Process smoothing aspects of the Toyota Production System. Principles of LeanSigma® Just in Time Just Just Just Just Jidoka Jidoka in Jidoka in Jidoka Jidoka in in Time Time Time Time Process Smoothing Process Smoothing Process Smoothing Process Smoothing Without all the elements, the house falls! Process Smoothing • 5S • Capacity & Demand management • Standard Operations
Process Smoothing • 5S • Capacity & Demand management • Standard Operations 5S is a powerful technique to improve productivity. IKEA video • A process and method for creating and maintaining an organized, clean, high-performance workplace • A conditioning discipline for improvement • The 5 Steps • Step 1: Seiri - Segregate & Discard • Step 2: Seiton - Arrange & Identify • Step 3: Seiso - Clean & Inspect Daily • Step 4: Seiketsu - Revisit Frequently • Step 5: Shitsuke - Motivate To Sustain
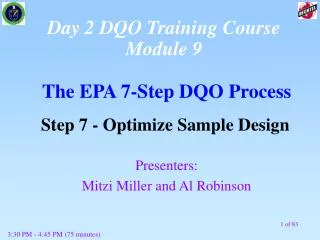
Example After Before
How Is 5S Done? 5S is accomplished by following all of the steps. Don’t skip a step! 5S is a team orientedprocess between themembers of the workarea.
S IMS examples of 5S S S S S How could you apply 5S to EZ Money? • What examples do you see at IMS for each of these techniques? • Step 1: Seiri - Segregate & Discard • Step 2: Seiton - Arrange & Identify • Step 3: Seiso - Clean & Inspect Daily • Step 4: Seiketsu - Revisit Frequently • Step 5: Shitsuke - Motivate To Sustain
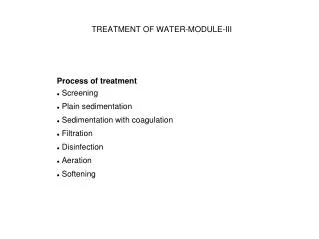
60 40 30 20 10 Smoothing techniques help us adapt our responses to variable demand. Variable volume Time 1 2 3 4 5 6 7 8 9 10 11 12 Customer or Request
Process Smoothing • 5S • Capacity & Demand management • Standard Operations Ideally, we should be able to match capacity to demand. capacity demand
A lack of balance creates issues. Capacity > Volume No Waiting High Error Rates High Costs Capacity < Volume Customers Waiting High Error Rates Low Costs Missed Expectations Capacity = Volume Good Customer Flow Fewer Errors Costs are Justifiable
Overburden reduces productivity. Surprisingly, underutilization can be as frustrating as overburden. • Occurs when process resources are pushed beyond the natural/designed limits or capacity: • Human Resources – overtime; inadequate training • Technical Resources – running at unrated speeds; no maintenance • Characteristics: • High Stress/Low Morale • Poor Quality • System Breakdowns/Outages • Reactionary Management • Consistent Overtime to Meet Schedules • Causes: • Inflexible Processes • Poor Capacity Management/Utilization/Scheduling • Improper Training (at all levels) • Lack of Process Capability
Forecasting demand timing and variation is critical. demand capacity Historical data and sales estimates are key inputs to forecasting. When does the work arrive to be processed? What is the variation over the year, month, week, day? How does the volume flow through the process?
In some cases, we can influence the demand for work. demand capacity • Perform internally-driven work at times when client demand is low • Reduce requirements for internally driven work • Plan new services that can be delivered in off-peak times • Offer customers incentives to order work in off-peak times
Example: Reduce requirements for internally-driven work We often assume activities are necessary just because we’ve always done it that way. An IMS team in the U.S. was checking 100% of work for errors. By using an FMEA (Failure Modes Effects Analysis) tool, they analyzed how often an error occurs and the impact of the error. The team realized an error occurred on average once every two years and the impact of the error was low. They decided to significantly reduce the amount of quality assurance and were able to eliminate the team’s overtime work.
The FMEA tool helps you assess risk. Click here for FMEA Template
Example: Develop Off-peak Services A snow shovel company had tremendous demand in fall and winter months. They decided to make garden shovels to generate demand in spring and summer.
When you can’t modify demand, you must change capacity. demand capacity • Capacity or workforce management determines the efficient allocation and scheduling of resources • Useful for highly complex and variable environments to maximize performance, while containing costs. Capacity = Resources * Time * Productivity
You can influence any component of the capacity equation to change your capability. Capacity = Resources * Time * Productivity How many people are working on each activity? How can we eliminate waste, flow, etc. to make work more efficient? How many shifts should we have? How can we optimize how work is grouped and assigned?
We’ve reviewed several techniques that can improve productivity. Capacity = Resources * Time * Productivity TIM WOOD (waste reduction) Flow and Pull 5S
Another productivity technique is Routing standardization. Similar kinds of work are grouped together to improve efficiency.
Routing Standardization Examples Grouping similar work together can eliminate bottlenecks. What happens if the same team works on huge projects and very small projects? • Auto industry – Vehicles with similar engines are built on the same platform rather than creating another line. Skills and processes are similar. • At IMS: • Simple customer questions are handled by a different team than complex customer questions. • In Offering Development, short development efforts are handled by a different group than large development efforts. • In Client Service, ad hoc work was separated from recurrent work.
Rationale for grouping work together Peaks and valleys in demand are complimentary Grouping would eliminate a bottleneck Equipment or skill sets are similar Optimizes a team’s utilization Helps keep pace with customer demand (e.g. the takt time v. cycle time bar chart)
Formal capacity management studies review all pieces of the capacity equation. Capacity = Resources * Time * Productivity What activities does the team perform? How many people are performing each activity? (resources) What is the sum of the available work time on the team? (productive work hours) How much time does it take to create a unit of work? (productivity)
Capacity studies are frequently used when significant business changes occur. Contact your Lean Lead if you think a capacity study is needed. A re-organization occurs, changing work activities or the number of people on the team An acquisition is integrated into the business. New services are developed, increasing a team’s workload. Demand changes sharply.
Capacity studies are complex, often done by teams of Lean practitioners. Click here for Detailed Capacity Study Guidelines Steps in a Capacity Study: • Understand volume requirements • Data is collected and analyzed for variation • Understand tasks, # employees, available work times, and cycle times per activity • Interviews and process observation are critical • Build a picture of the current process (the value stream map) • Suggest changes to improve productivity (e.g. re-grouping work, eliminating some work) • Build a capacity model showing ranges of FTEs needed to handle various levels of demand
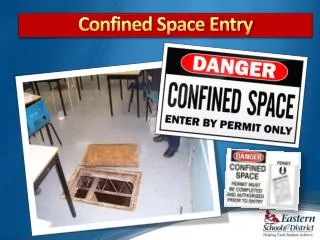
Input Process Output Critical Success Factors Process Resource Requirements Existing Schedules Customer Deadlines LeanSigma ® Customer Arrival Pattern Workforce Volume Management Limiting Resources Controllable Factors Non - Resource Scheduling Productivity Training Curve Capacity models provide guidance, not exact numbers.
Process Smoothing • 5S • Capacity & Demand management • Standard Operations Standard Operations The best way to complete a process with the most efficient use of resources… Articulated clearly so that employees can follow and sustain the process.
Pacing to takt time Establishing the activities and order of activities assigned to each associate Step 1 Step 2 Step 3 Standard Operations
Standard Operations are the culmination of many Lean techniques. Waste elimination Flow and Pull Takt time 5S Resource (Capacity) management Routing Standardization
Standard Operations • Why implement standard operations? • To make it possible to identify and eliminate variations in associates work • To sustain the gains achieved from past kaizen activities • To provide a baseline for future kaizen activities • How do you use standard operations? • Document each standard process • Display the documentation • Ensure that all associates are trained