Download
1 / 18
200 likes | 387 Views
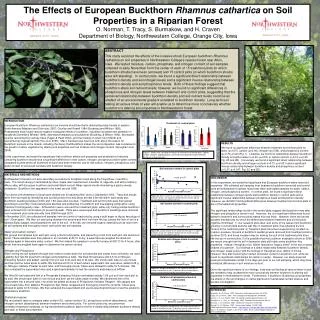
Effects of N Deposition on Soil Respiration in the Harvard Forest. By: Christian Arabia Mentors: Kathleen Savage Eric Davidson Werner Borken. The Chronic N Study Site. Located on Prospect Hill tract at Harvard Forest Designed and initiated by John Aber of University of New Hampshire

E N D
Effects of N Deposition on Soil Respiration in the Harvard Forest By: Christian Arabia Mentors: Kathleen Savage Eric Davidson Werner Borken
The Chronic N Study Site • Located on Prospect Hill tract at Harvard Forest • Designed and initiated by John Aber of University of New Hampshire • 2 sites: red pine stand, and mixed hardwood stand. • 3 plots within each site: • high N addition site (150 kg N Ha-2 yr-1) • low N addition site (50 kg N Ha-2 yr-1) • control plot (no N)
Canopy and ground level vegetation • After 13 years of ammonium nitrate additions, the treatment plots show marked differences in canopy and ground level vegetation growth and structure. • Generally, as the amount of N fertilization increases, canopy coverage and ground level vegetation decrease
Canopy Structure (Pine) Clockwise from left: High treatment Low treatment Control
Canopy Structure (Hardwood) Clockwise from left: High treatment Low treatment Control
Ground Level Vegetation (Pine) Clockwise from left: High Treatment Low Treatment Control
Ground Level Vegetation (Hardwood) Clockwise from left: High Treatment Low Treatment Control
Soil Respiration Sampling • Ground level soil respiration was measured at 6 randomly placed collars within each site (36 total) • A Licor 6252™ backpack system was used to record CO2 concentrations every 12 sec. • A linear regression was run on concentrations to calculate fluxes of CO2
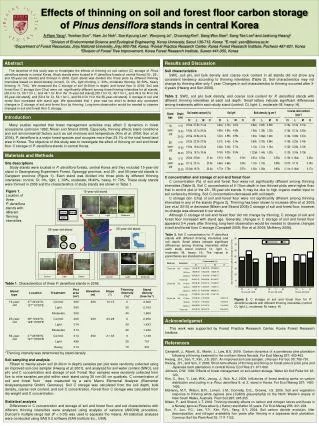
Trends in Soil Respiration Chart 1. Average CO2 fluxes by plot at Chronic N study site (June 6 – August 6, 2001)
Explaining Differences • Why/How does N fertilization decrease CO2 fluxes? • 2 Hypothesis: • Decreased root respiration • Decreased microbial activity
Soil Incubation Experiment Why: To measure CO2 respiration that can be attributed solely to microbial decomposition • 6 soil samples were taken from each of the plots • 10cm of soil from “A” layer down • Approx. 30g of soil for each replication • Roots were removed and soil was sieved (1mm) • Field moisture was measured gravimetrically
Incubating the soils • 20g of soil (at field moisture) from each sample was placed into a 1pt. Mason jar. • The jars were opened before the incubation so that they would equilibrate with ambient (outdoor) air. • The jars were sealed one at a time and 5ml of gas was collected at times 0, 60, 120 and 180 min. • Samples were injected immediately into a Licor 6252™ I.R.G.A. • A linear regression was run on the concentrations in Mason Jars over time and was used to calculate the flux rate of CO2
Running the samples Pump Soda Lime Scrubber IRGA Mixing Chamber Valve Sample
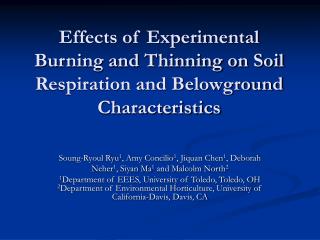
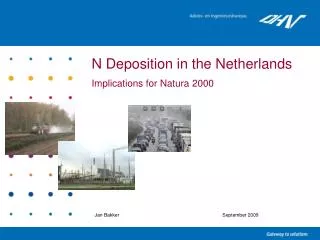
Trial 1 CO2 Fluxes Chart 2. Average CO2 fluxes from incubation.
Summary • Trends in average respiration fluxes from soil incubations are similar to those seen in field respiration sampling • N saturation shown for both pine and hardwood • Data suggests microbial decomposition is primary factor affected by N saturation.
Acknowledgements I would like to thank my mentors, Kathleen Savage, Eric Davidson and Werner Borken for their help and guidance with this project, as well as my partners, Rosa Navarro and Linda Wan. I would also like to show my appreciation to Allison Magill and John Aber for their willingness to allow me to sample from their experimental plots.