Download
1 / 8
80 likes | 267 Views
1. Set up your data in two columns: x, y include 0,0. X value y value. 2. Highlight your two columns. 3. Under the “Chart” tab, choose a “straight marked scatter”. 4. Graph will appear and you will need to create appropriate title. 5. Remove legend. 6 . Add titles to axes.

E N D
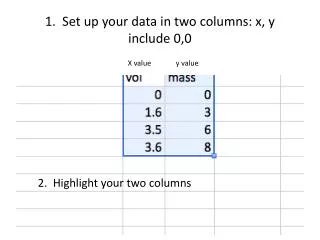
1. Set up your data in two columns: x, yinclude 0,0 X value y value 2. Highlight your two columns
3. Under the “Chart” tab, choose a “straight marked scatter”
4. Graph will appear and you will need to create appropriate title


![Tell a Story! [Be the Batman]](https://cdn4.slideserve.com/7369331/slide1-dt.jpg)