Download
1 / 6
60 likes | 178 Views
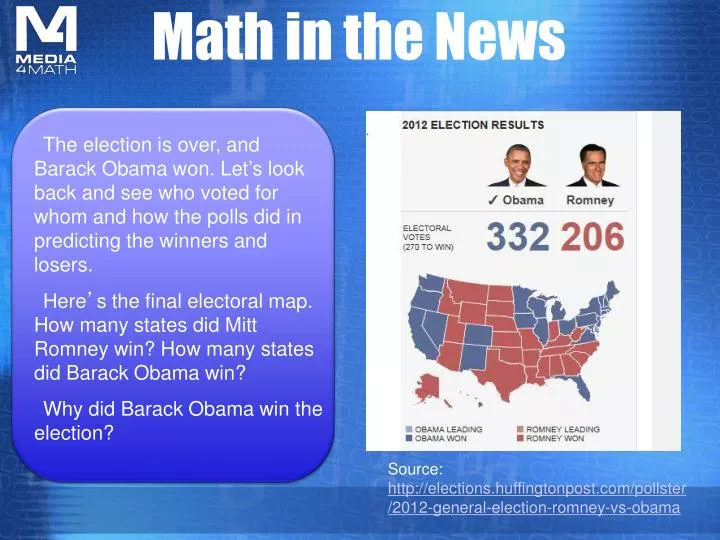
The election is over, and Barack Obama won. Let ’ s look back and see who voted for whom and how the polls did in predicting the winners and losers. Here ’ s the final electoral map. How many states did Mitt Romney win? How many states did Barack Obama win?

E N D
The election is over, and Barack Obama won. Let’s look back and see who voted for whom and how the polls did in predicting the winners and losers. Here’s the final electoral map. How many states did Mitt Romney win? How many states did Barack Obama win? Why did Barack Obama win the election? Math in the News The Butterfly Migration Source: http://elections.huffingtonpost.com/pollster/2012-general-election-romney-vs-obama
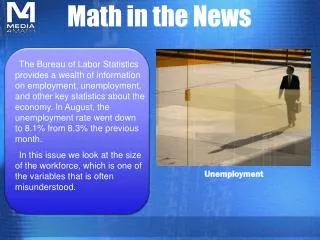
Math in the News • Many people took polls of voters. They were trying to predict who would win the election. Click on the interactive tool to track what the polls said throughout the election season. • http://elections.huffingtonpost.com/pollster/2012-general-election-romney-vs-obama
Math in the News • How does polling work? Experts try to reach an evenly matched sample not skewed to one party or another. They combine data from many sources into computer models to make their best estimate. • Check out this chart. How did the pollsters do? • Source: http://fivethirtyeight.blogs.nytimes.com/2012/11/10/which-polls-fared-best-and-worst-in-the-2012-presidential-race/#more-37396
Math in the News • You may have heard that more women voted for President Obama than for Governor Romney • Look at this graph. What does it say about how women voted? • Source: http://www.huffingtonpost.com/david-c-wilson/the-elephant-in-the-exit_b_2094354.html?utm_hp_ref=@pollster
Math in the News • Which candidate did young people vote for? What about older people? Do you remember? If not, make a prediction and find out what happened on the next slide.
Math in the News • How did you do? Were your predictions correct? • As you’ve seen, pollsters made predictions, too. Sometimes they’re right, but not always. Polling is not an exact science. • .