
1941 1963 1983
E N D
Presentation Transcript
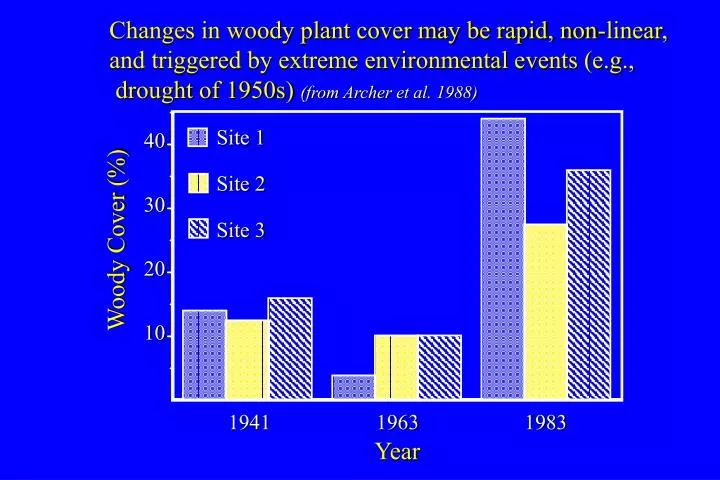
Changes in woody plant cover may be rapid, non-linear, and triggered by extreme environmental events (e.g., drought of 1950s) (from Archer et al. 1988) 40 30 20 10 Site 1 Site 2 Site 3 Woody Cover (%) 1941 1963 1983 Year
Woodlands Groves Clusters Herbaceous Changes in Woody Plant Cover (1950-1990) La Copita Site, Texas Landscape 1 (1950) 1976 (5.26 ha) 1990 (6.52 ha) 1950 (3.59 ha)
Annual measurements of soil respiration (McCulley 1999) coupled with a successional model of vegetation change (Scanlan & Archer 1991), indicate soil CO2 flux may have increased ca. 10% subsequent to woody plant encroachment Woody Patches Herbaceous Patches 8000 6000 4000 2000 10% 4% Area Weighted CO2 Flux (kg C ha-1 y-1) - 200 years Present + 200 years (1983)
Annual N-Mineralization Patch Type (µg g-1 y-1) Herbaceous 42 + 5 Shrub Cluster 200 + 18 Grove 137 + 16 Woodland 127 + 29 Annual Nmin in southern Texas are highest in soils associated with woody vegetation known to have developed over the past century (from Hibbard et al. 2000)
20 Dry Soil Wet Soil 15 mg NO cm-2 hr-1 10 5 0 Herbaceous Grove Woodland Patch Patch Patch Upland, Sandy Loam Low land, Clay Loam NITRIC OXIDE FLUXES La Copita Site, Texas (from Cole et al. 1996)
Increases in woody plant abundance have increased NMHC emissions 3-fold at the La Copita site.
SOC in Grazed Grasslands La Copita Site, Texas(from Hibbard 1995) 4.0 Onset of Heavy Grazing 3.5 Lowland (Clay Loam) Soil Organic Carbon (kg m-2) 3.0 Upland (Sandy Loam) 2.5 1750 1800 1850 1900 1950 2000 Year
Historical Changes in Plant Carbon Pool La Copita Site, Texas (from Hibbard 1995) "Pristine" Grassland 4.5 Heavily Grazed Grassland Grass + Woody Patches 3.5 2.5 Plant Carbon (kg m-2) 1.5 0.5 1900 1910 1920 1930 1940 1950 1960 1970 1980 1993 Year
Historical Changes in Soil Carbon Pool La Copita Site, Texas (from Hibbard 1995) "Pristine" Grassland 3.5 Heavily Grazed Grassland Grass + Woody Patches 2.5 Soil Organic Carbon (kg m-2) 1.5 1900 1910 1920 1930 1940 1950 1960 1970 1980 1993 Year
Estimates of C-sequestration by dryland woody plants must account for deep root systems (photo by S. Archer, La Copita site, Texas)
(from Archer et al. 2000) Aggradation Phase Degradation Phase Tree/shrub-driven Herbaceous retrogression succession high Nutrient pools & fluxes Productivity Biodiversity Tree-shrub community Woody plant development establishment low Time • heavy, continuous grazing • elimination of fire • minimal browsing